
Event Details – Reducing Alert Noise with Context, Not Just Data
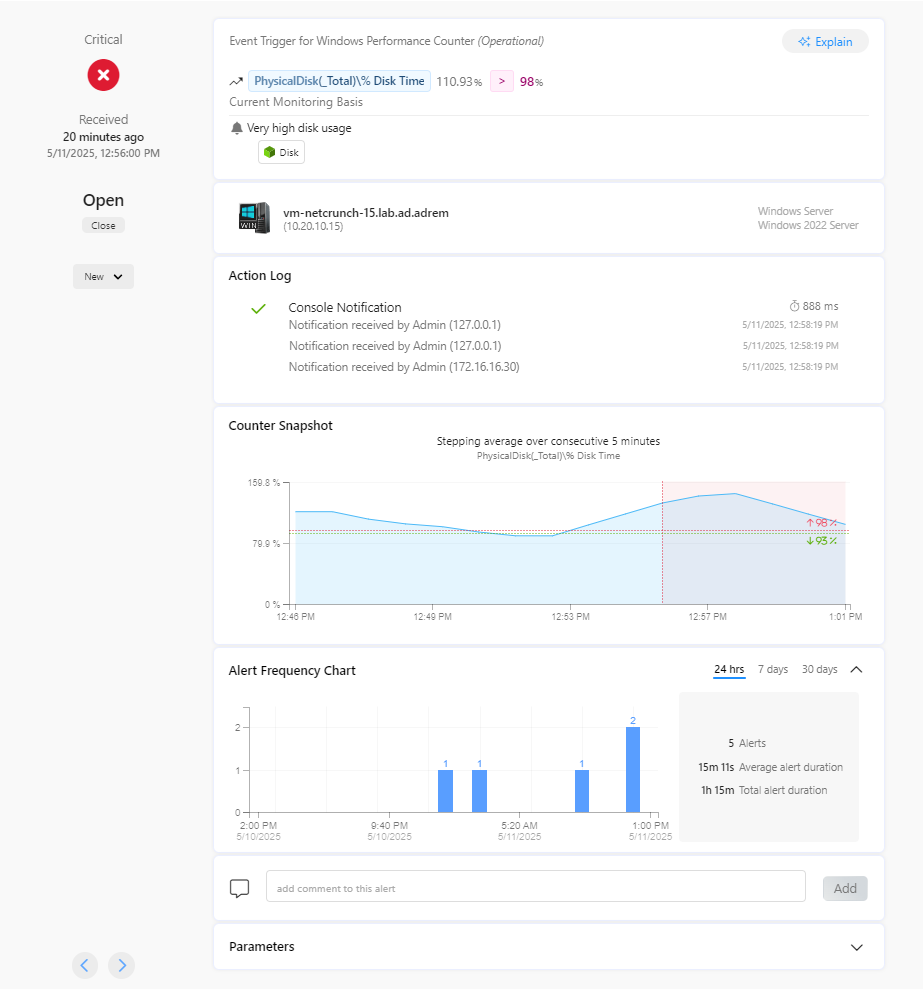
The Event Details window in NetCrunch transforms alerts into actionable insights. It explains what triggered an alert, how often it happens, how critical it is, what response actions were taken, and what the system recommends next. Its purpose is to reduce alert overload and help you focus on what truly matters.
Purpose
NetCrunch doesn’t just tell you that something went wrong—it shows you why, how often, and what to do about it. The Event Details window is where that happens.
It’s designed to:
- Help users assess whether an alert is actionable
- Prevent alert fatigue by surfacing trends and suppressible noise
- Make the monitoring system self-explanatory, not cryptic
- Enable confident alert tuning and policy refinement
While other systems show a title and a value, NetCrunch shows a timeline, a frequency model, live counter correlation, action results, and AI-powered explanations.
Assessing an Alert with Confidence
Identify Alert Fatigue Sources
The Alert Frequency Chart shows how often this event has occurred in the last 24 hours, 7 days, or 30 days.
You can instantly spot:
- Repeated short spikes → likely too sensitive
- One sustained alert → likely a real issue
- Unstable, flapping patterns → candidate for suppression
This chart turns anecdotal "this alert keeps firing" into measurable, visual evidence.
Use Context to Confirm Severity
The Counter Snapshot graph shows whether the alerting condition was a momentary deviation or part of a long trend.
With threshold and reset lines clearly drawn, you can assess:
- Was this a brief violation?
- Is the counter still elevated?
- Does the condition merit action or tuning?
This visual clarity prevents overreaction and encourages accurate prioritization.
Check for Auto-Resolution or Upstream Closure
The left-side panel always shows:
- How the alert ended (auto-close, closed by event, or manually resolved)
- How long it lasted
- Whether it’s still active
If it was closed by a parent node issue, that relationship is shown too—so you know not to chase symptoms of a higher-level problem.
Understand the Monitoring Basis
Every alert includes its Monitoring Source:
- The sensor or monitoring pack responsible
- The triggering condition (e.g. “CPU Usage > 75%”)
- The actual value when the alert fired
- Whether averaging or sampling logic was used
This links policy to behavior—no more guessing how something was monitored.
See What Was Done (and Whether It Worked)
The Action Log shows:
- All automated responses triggered by the alert
- Notification history (e.g., emails, webhooks)
- Script or command execution results, including logs and output
This provides transparency and confidence. You don’t have to wonder whether a restart script failed or an alert was never sent—you can see it right here.
Let the AI Help Explain It
With the Explain button, NetCrunch gives you a contextual explanation of:
- Why the alert was triggered
- What the monitored value means
- Common root causes
- Suggested next steps
Especially useful for junior staff or occasional operators, this turns raw metrics into understandable action paths.
Inspect the Parameters Behind the Trigger
For threshold-based alerts, the Parameters section shows the full logic:
- Threshold value
- Reset value
- Sampling logic
- Whether averaging was used
- Monitoring interval
- Internal IDs and logic type
This allows anyone to reproduce the logic, debug it, or fine-tune it confidently. It’s built for transparency, not magic.
Comment, Acknowledge, or Escalate
The event window also supports human input:
- Add comments to track decisions, handoffs, or investigations
- Mark alerts as acknowledged or resolved
- Use it as a collaboration thread for incidents
No need to leave the alert context to document your work.
Why This Matters
Most monitoring tools show alerts as fragments. NetCrunch shows alerts as fully contextual events—with history, cause, trend, resolution, and interpretation—all on one screen.
That means:
- Less guessing
- Fewer false positives
- Easier tuning
- Faster reactions
- Better decisions
This is not just a window. It's your first defense against alert fatigue.