
Status & Top Charts Dashboards
dashboards-overview
NetCrunch offers multiple dashboard types to visualize real-time system and network status. Each is designed for different scenarios: overview status, performance leaders, or fully customizable layouts.
NetCrunch provides three powerful types of dashboards that adapt to different monitoring needs. Each type offers distinct features for visualizing, interacting with, and drilling into system health and performance data.
Status Dashboard
This built-in dashboard type is available for all node-based views:
- IP Networks
- Physical Segments
- Node Groups
- Dynamic Folders
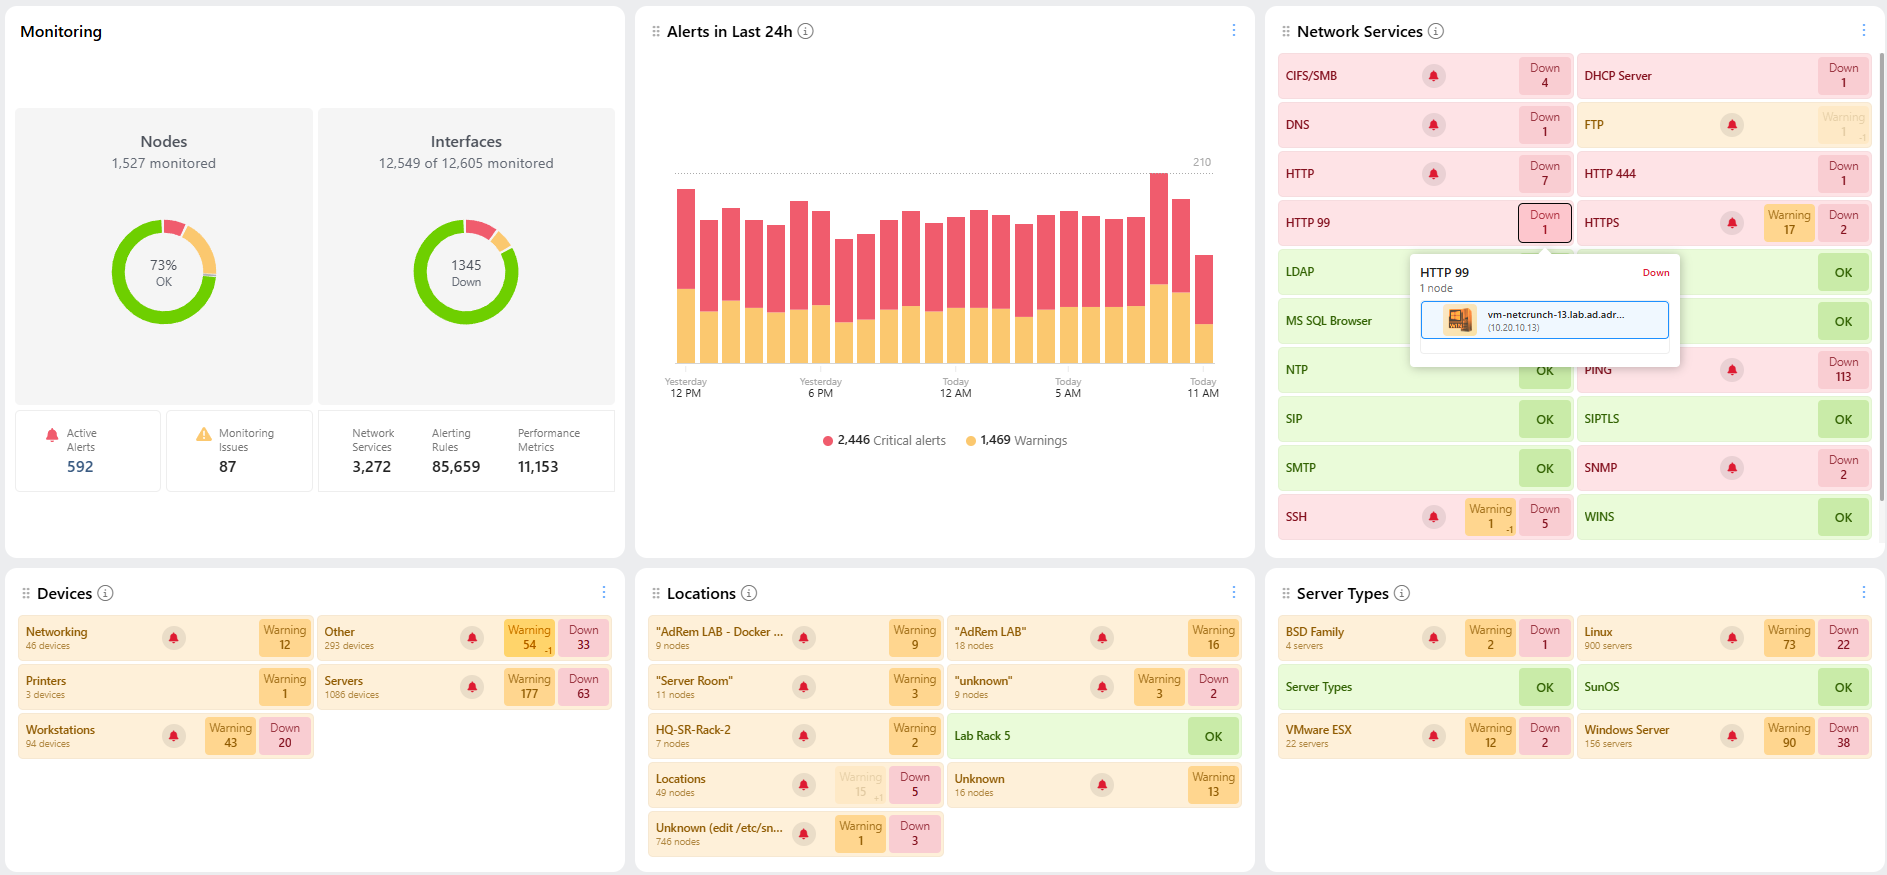
The Status dashboard provides a structured summary of the monitored environment, with interactive tiles showing alert levels, counts, and categories.
- The Overview view has extended layout and can include custom status panels focused on selected groups or nodes.
- Each alert/warning tile includes tooltips and hint overlays showing which nodes are affected.
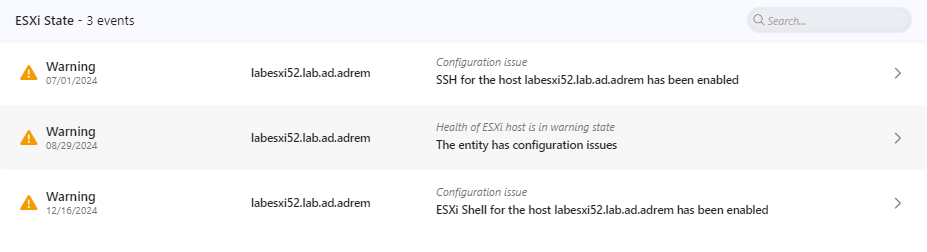
- Clicking on an alert icon shows the list of active alerts, which can be expanded into a detailed event view.
Example: Overview Status Dashboard
Example: Alert Popup from Status Panel
- The alert chart is clickable—selecting a bar opens the 24h alert history.
- All dashboard tiles are interactive and link to relevant drill-down views.
For non-overview views, the dashboard layout includes six default tiles: - Monitoring Summary - Alerting (24h) - Network Services - Monitoring Packs - Monitoring Engines - Sensors
Tile order is customizable.
Top Charts Dashboard
Available for any node-based view, this dashboard shows ranked performance charts, for example:
- Top nodes by bandwidth usage
- Interfaces by error rate
- Highest CPU or memory usage
Example: Top Charts Dashboard with Selected Metrics
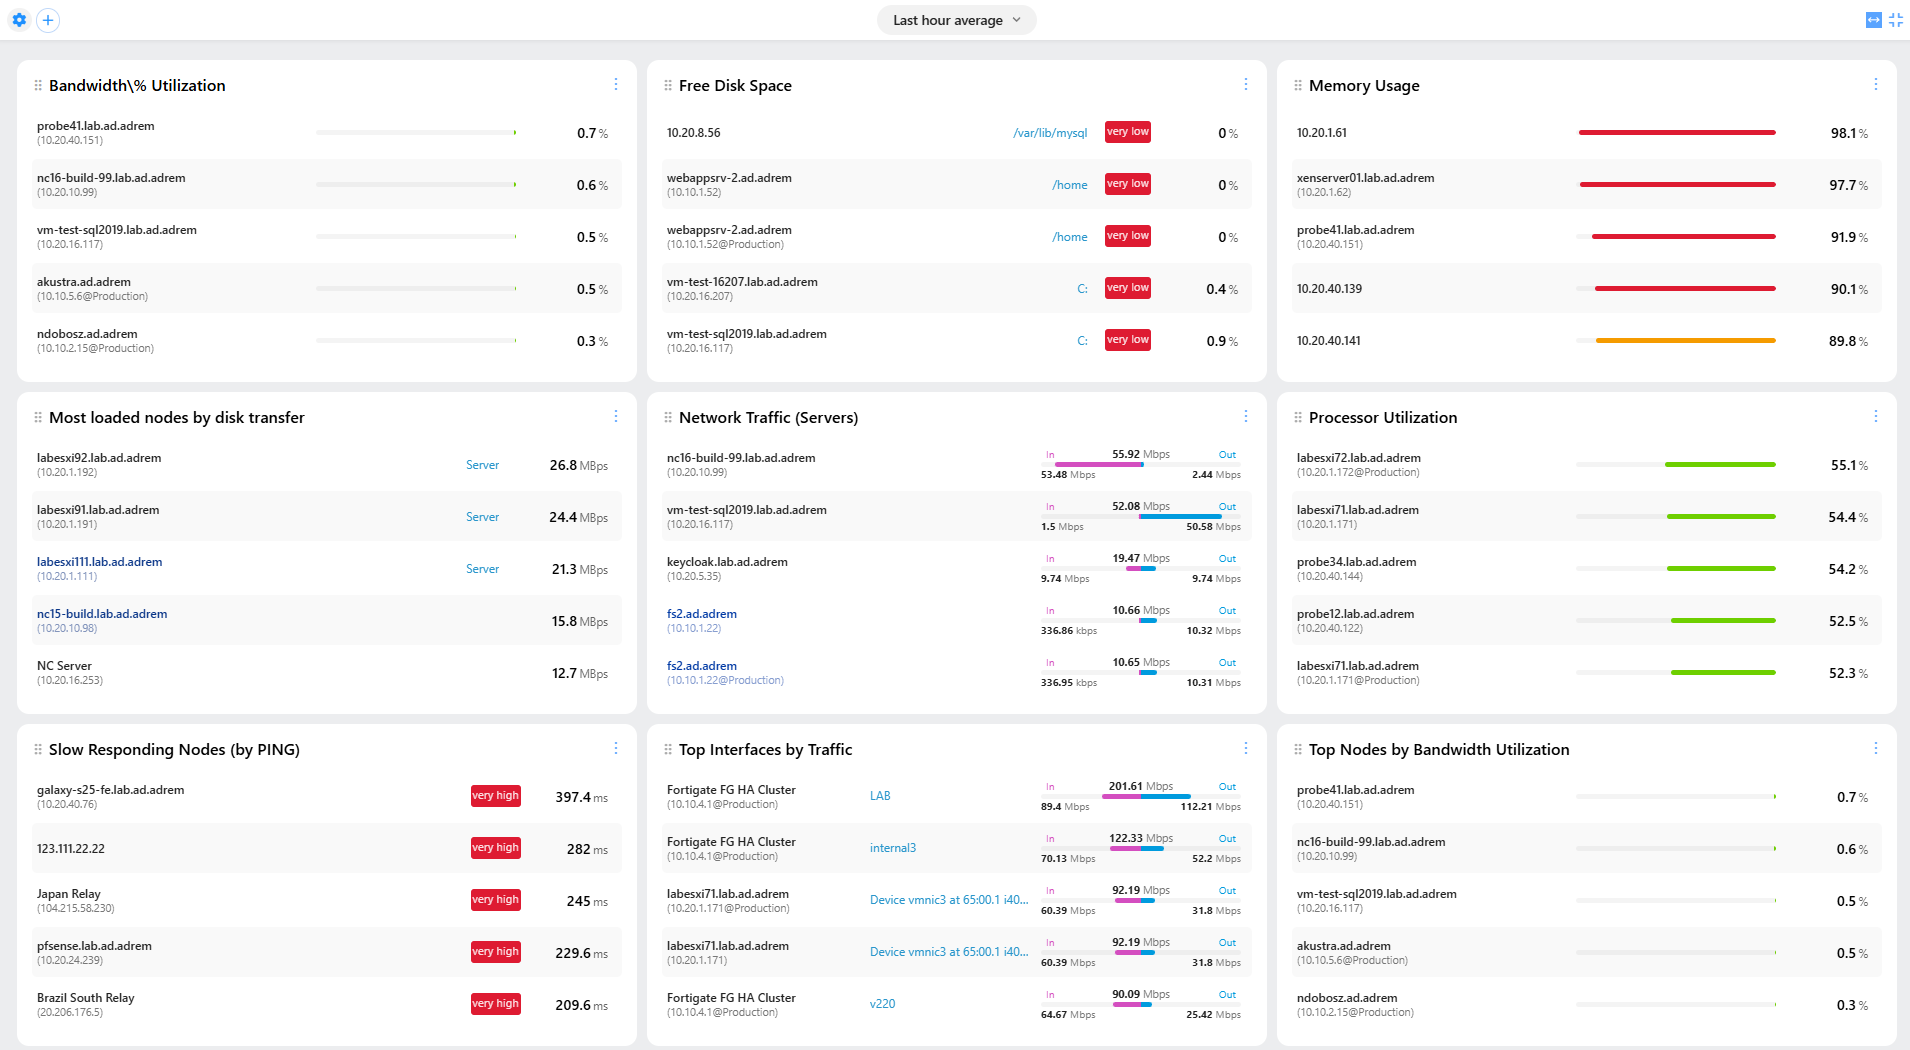
Each chart: - Can be selected from built-in templates - Can be fully customized with user-defined counters - Supports click-through to open trend viewer (for single series or entire tile)
User can control: - Number of items shown - Sorting direction (highest/lowest) - Alert thresholds (critical, warning) - Filtering by node importance
Custom Graphical Dashboards
To build entirely custom views, users can create Graphical Views with widget panels or boundless canvases. These dashboards support:
- Custom layout
- Live data binding
- Theme support (light/dark)
- Full interactivity and drill-down