
External Event Sources
See how to create an alert for Syslog messages, SNMP traps, Web Messages, and Windows Event Log entries.
NetCrunch can act as a log server for external events. It can store them in the NetCrunch Event Log and perform defined alert actions (i.e., notifications) as the response. You can also correlate incoming events to track active alerts.
syslog
Syslog Server
Settings Monitoring Syslog Server
You can change the port on which NetCrunch listens to Syslog messages (default 514) and set the option to forward each message to another Syslog server.
Message Grouping
NetCrunch waits for a given time frame and groups the same messages. This helps to avoid flooding with the same messages. This may happen in case of a device or service failure.
Configuring Syslog Alerts
Configuring the NetCrunch Syslog server is the first step, while the next one is creating alerts.
You can add an alert to a node sending Syslog messages and specify a filtering condition for the received message. As such, you can create different alerts for different messages.
Only messages matching defined alerts (filters) pass into NetCrunch, whereas others are discarded.
Go to Settings Alerting & Notifications Monitoring Packs and Policies. In the desired monitoring pack, click Add Alert and choose 'New Event for Received Syslog Message.'
You can also go to Node SettingsMonitoring, click on the Syslog tile in the Node section, and click Add Alert.
The window will allow you to declare expected message parameters.
web-messages
Web Messages
Settings Monitoring Web Messages Receiver
You can easily send an event message to NetCrunch using an HTTP request. The program accepts POST and GET requests. For example, we skip the first part of the URL, your NetCrunch Server Web Access URL. We strongly recommend configuring the server to use HTTPS protocol.
You can use the cURL program (available on multiple platforms) to send requests to NetCrunch. You can download it from curl.haxx.se.
Service URL
http://<nc-server>/api/rest/1/event/<node-identification>
Node identification is a node IP address or DNS name.
Sending message by GET
The simplest way is attaching the message to the URL as a search string.
api/rest/1/event/crm.acme.com?CRM%20must%20be%20restarted
Because URLs cannot contain spaces, it must be properly encoded.
If you form a query string as a parameter list, it will be converted to a JSON object, and then you can create alerts based on these parameters.
Example:
api/rest/1/event/crm.acme.com?error=1
Sending message by POST
NetCrunch accepts data encoded as typical form encoding application/x-www-form-urlencoded and allows filtering events on parameters. Another accepted encoding is JSON application/json.
Curl Example
curl -d "error=1" http://192.168.10.112:8008/api/rest/1/event/192.168.10.1
Configuring Web Messages
NetCrunch can receive messages by default. You can disable this feature and set the message grouping option.
Message Grouping
NetCrunch waits for a given time frame and groups the same messages. This helps to avoid flooding with the same messages. It may happen in case of a device or service failure.
Configuring Web Message Alerts
You can add an alert to a node that sends web messages and specifies the filtering condition for the received message. So you can create different alerts for different messages.
Only messages matching defined alerts (filters) pass into NetCrunch, whereas others are discarded.
Go to Settings Alerting & Notifications Monitoring Packs and Policies, in desired monitoring pack, click Add Alert and choose 'New Event for Received Web Message.'
You can also go to Node SettingsMonitoring, click on the Web Messages tile in the Node section.
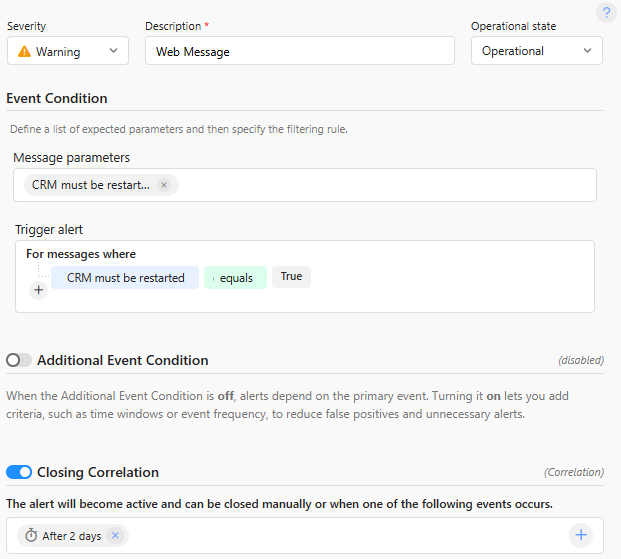
The window will let you declare the expected message parameters and create a filter for the messages.
Example
Let's define a simple message alert where any non-empty message will be logged.
snmp-traps
Receiving SNMP Traps
NetCrunch receives SNMPv1, SNMPv2, and SNMPv3 traps. It can also forward all received traps to another SNMP manager. Forwarding can be set in Settings Monitoring SNMP Trap Receiver.
On the Settings page, you can check the current status of the SNMP trap receiver. If SNMP is not enabled, click the button, enable it, and set its options.
You can change the port on which NetCrunch listens for SNMP traps (default 162) and set the option of forwarding traps to another SNMP manager.
Trap Message Grouping
NetCrunch waits for a given time frame and groups the same SNMP trap messages. This helps to avoid flooding with the same messages.
Configuring SNMP Trap Alert
You can add an alert to the node sending an SNMP trap by creating a trap alert. You can also receive traps in the External Events window and click on the desired trap to create an alert.
To add a trap alert, go to Node SettingsMonitoring and click on the SNMP Traps tile in the Node section.
To add an SNMP trap to the Monitoring Pack, the SNMP only option must be checked. Otherwise, SNMP events will not be visible.
windows-events
Monitoring Windows Event Logs
Settings Monitoring Windows Event Log Collector Monitoring Windows Event Log is enabled by default. It's not just a passive receiver like SYSLOG or SNMP trap. The event Log monitor connects to a remote machine and needs authentication to registetooreceiveng Windows Event Log events. It is rather an extension of the Windows Monitoring Engine.
When you click the Windows Event Log button on the Monitoring tab, you can change the Windows Event Log engine's global options.
Event Log Entries grouping
NetCrunch waits for a given time frame and groups the Windows Event Log entries.
Configuring Windows Event Log Alert
Windows Event Log monitoring has the same requirements as standard Windows monitoring. It requires node OS monitoring to be set to Windows. Then you can go to the Windows Event Log tile under the Windows section in Node Settings and add an alert.
Alternatively, you can create a new Monitoring Pack with a set of rules to monitor Windows Event log in Settings Alerting & Notifications Monitoring Packs and Policies
You can also find the 'Security Audit' Monitoring Pack in the global section of defined monitoring packs. It contains alerts based on selected events from the Windows Event Log - Security category.