
Architecture and Concepts
Overview of NetCrunch Server architecture. Learn more about Monitoring Engines, NetCrunch Consoles, databases, additional tools, and critical concepts of advanced network visualization.
Architecture
NetCrunch is a comprehensive system consisting of many components that communicate with each other. Most of them work on the NetCrunch Server, and configuration can be done with the Administration Console that users can run remotely (recommended). The monitoring engine is responsible for performing monitoring tasks - the same set of processes included in the Monitoring Probe. Flow analysis is no longer part of that single environment: the Flow Server is a separate, distributed component, and there can be one per network site. See Flow Servers below.
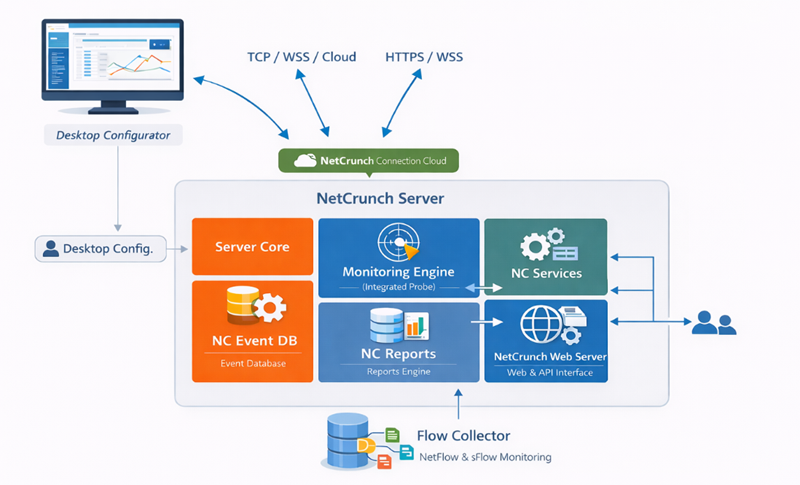
The server works best on a dedicated machine (virtual or physical) with the appropriate resources assigned. If you want to process Gigabytes of data, you need SDD disks and a multicore machine. Read more in System Requirements.
NetCrunch Server also works well with vSphere Fault Tolerance, which provides continuous availability for NetCrunch Server.
NetCrunch Components
Server Processes
The complete list of NetCrunch services is as follows:
- NetCrunch Server
- A central server provides monitoring logic, performance trend storage, and communication infrastructure for other components. It is a parent process for additional services, such as
Monitoring Engine,NC ServicesandNC Event DB. - NC Services
- Additional background processes working as server extensions. It handles actions, integrations, message processing, task scheduling, etc.
- NC Event DB
- It handles the event database and all its tasks. The Event Log runs on PostgreSQL. See NetCrunch Databases.
- NC Reports
- Report rendering engine
- AdRem NetCrunch Flow Server (Optional)
- Receives and analyzes flow data (NetFlow, sFlow, IPFIX and others). Unlike the services above it should not run on the NetCrunch Server - see below.
- NetCrunch Data Updater
- Updates various files used by NetCrunch.
- NetCrunch Guard Service
- Watches server execution.
- NetCrunch Web Server
- NetCrunch embedded Web Server provides Web Console, Mobile Console, and REST API services. It uses the latest security patches and includes support for HTTPS, including TLS 1.3
Monitoring Engine
The monitoring engine process is the monitoring probe integrated into the server. It collects all monitoring data. It runs as a separate entity and manages separate engines for monitoring Network Services, SNMP, Interfaces, OS Monitors, Virtualization, and hundreds of sensors.
Operating system monitoring for Windows, macOS, Linux, Solaris, BSD, ESXi, or Hyper-V depends on appropriate node settings. See: Automatic Monitoring and Organizing.
flow-servers
Flow Servers
Flow collection is distributed. A Flow Server can be installed (not recommended) on the NetCrunch Server, or on any machine that is accesible by Monitoring Probe* — which is what lets flow data be collected in a remote location without shipping every packet across the WAN.
You configure one per network site. Each site has its own entry holding:
- the Flow Server Address or Name, and the Probe that reaches it
- the IPFix and sFlow listening ports
- how long to keep flows, in days or indefinitely
- whether to enforce the sFlow sampling rate — with it on, packet and byte counts are scaled up from the sample to estimate real traffic; with it off, the raw sampled values are used and will under-report
The connection to the Flow Server is made from the Probe, not from the NetCrunch Server. In a site's settings, for example, 127.0.0.1 therefore means the Probe machine itself — which is the normal case when the Flow Server and the Probe are installed together.
Because there is a Flow Server per site rather than one for the whole atlas, the console shows flow status per site: not installed, disabled, unlicensed, disconnected, connected, warning or error. Devices are pointed at the Flow Server for their own site.
Consoles
Administration Console
You can configure NetCrunch with the Desktop Administration Console, which you can install on any Windows system.
The console can utilize three different connection encrypted methods:
- local (TCP)
- WebServer (WSS)
- NetCrunch Connection Cloud (HTTPS, WSS)
We recommend using an SSL certificate for the NetCrunch Web Server, even for local use. This allows your Desktop Console to establish a secure SSL connection as well. For remote access, you can safely use the console over the internet through NetCrunch Connection Cloud.
The console caches large amounts of data and transfers only changes over the network, ensuring that updates appear instantly without requiring a manual refresh. It also supports the creation and saving of complex screen layouts, including multi-screen setups.
Web Console
It is a modern HTML console that allows instant access to the server. It requires browsers not older than 1 year. You can manage access to the console through user accounts and access rights profiles.
Web Console provides mostly browsing capabilities. You might need an Administration Console to edit monitoring configuration and monitoring policies. Graphical Data views can be edited in Web Console, though.
Mobile Console
The Mobile Console is a Progressive Web App (PWA) for accessing NetCrunch from smartphones and tablets. It provides access to all monitored data and supports most features available in the Web Console. It is not a reduced or limited companion application.
The Mobile Console can operate securely over NetCrunch Connection Cloud (NCC). You do not need to expose the NetCrunch Web Server to the Internet or configure inbound firewall access. Communication is relayed through the secure NCC cloud connection.
The easiest way to install the Mobile Console is to scan the QR code available on the Resources tab of the Help panel.
Why a PWA
NetCrunch deliberately uses the Progressive Web App model instead of separate native mobile applications. It follows the original idea behind early iPhone web applications: applications delivered directly through the web without requiring an App Store, a platform-specific SDK, or separate release processes.
This approach has several practical advantages:
- No App Store installation or approval cycle. The console is delivered directly by NetCrunch
- No separate iOS and Android applications. The same application and UI architecture runs on both platforms
- Faster updates. Changes to the NetCrunch UI become available to the Mobile Console without waiting for a new mobile application release
- Always current. As the Web Console evolves, the Mobile Console receives the corresponding interface changes automatically
- Consistent experience. iPhone and Android users work with the same NetCrunch concepts, navigation, data, and functionality
The result is a mobile console that remains closely aligned with the main NetCrunch interface instead of becoming a separately maintained, increasingly outdated companion application.
The Mobile Console:
- works on iPhone and Android
- supports push notifications
- requires Chrome 121+ or Safari 17.3+
- can be installed as a PWA directly on the device
- provides access to the same NetCrunch data available through the Web Console
Basic Concepts
NetCrunch was initially designed to monitor hundreds of devices and thousands of parameters. However, it scales seamlessly to monitor thousands of devices and hundreds of thousands of parameters using a single server. Our approach to scaling emphasizes both performance and ergonomics.
The policy-based configuration makes managing complex infrastructures straightforward. Rather than setting individual alerts and reports for each monitored node, which can be time-consuming in other programs, NetCrunch automatically applies these settings based on predefined policies. This significantly reduces the time required to configure and manage each node.
Network Atlas
Network Atlas is a central database containing all your network data. It's organized by the hierarchy of the Atlas Node Views.
It contains all your network data and helps you organize it into various views. Many of the views are created automatically.
The fundamental element of the Atlas is a network node—a single-address network endpoint. The Atlas Tree shows the hierarchy of all views and helps you quickly recognize the status of each element.
Atlas Views
Atlas Node View shows various aspects of the group of nodes in the Network Atlas and consists of multiple pages such as nodes, maps, dashboards, and others.
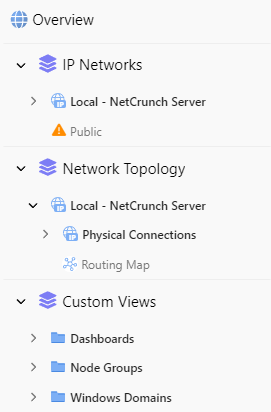
Atlas begins with a top root view of all nodes. This view shows top-level dashboards such as Status, Top Charts, and Flows.
The rest of the views are divided into sections:
IP Networks
This section consists of IP network views/maps. Each network can be periodically re-scanned to reflect its current state, and you can create a custom graphical map for each view. By default, node view shows node icons automatically arranged by device model and OS name.
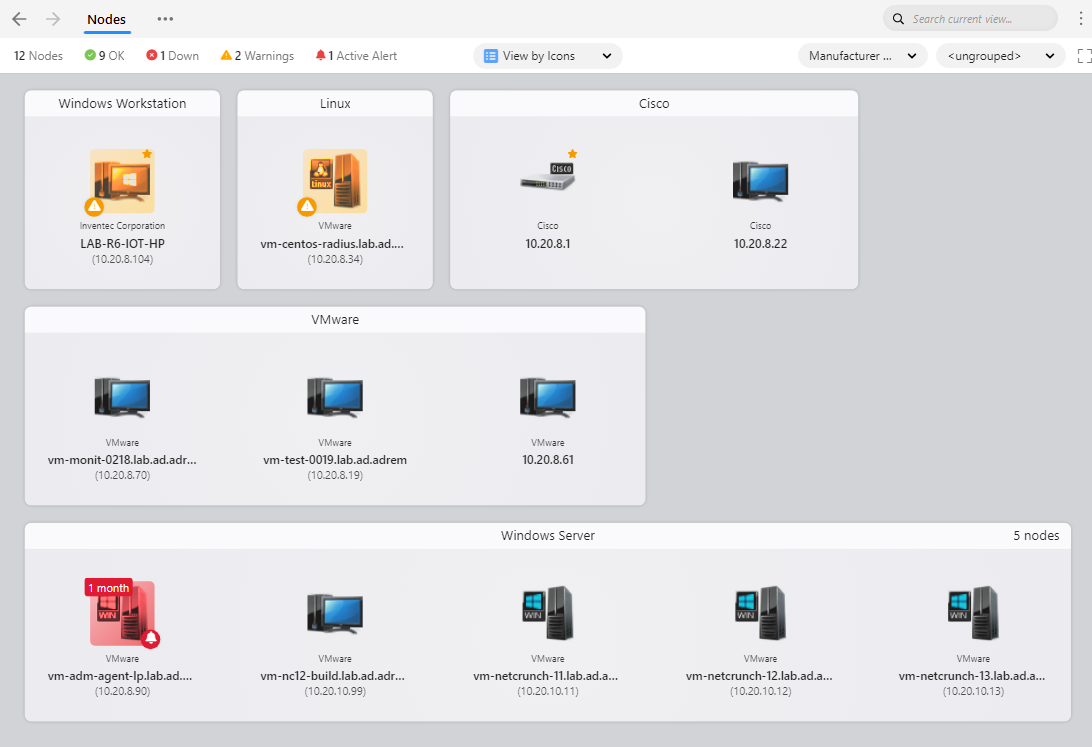
Sites
We introduced the concept of sites (aka address spaces) to prevent confusion when monitoring nodes with the same network addresses.
- Local - NetCrunch Server - means all addresses visible (local) by NetCrunch Server. You can place an additional Monitoring Probe within this address space for load balancing.
When two locations use the same private network address, they create two distinct sites.
Network Topology
This section contains views regarding network topology. It includes logical (routing) and physical connection maps (layer 2).
Routing Map
The view shows connections between IP networks and devices, providing these connections (routers).
Physical Connections
The top-level view shows connections between switches, and then each switch port mapping is represented on a separate view. Each segment (single switch) view automatically presents the traffic summary on each switch port.
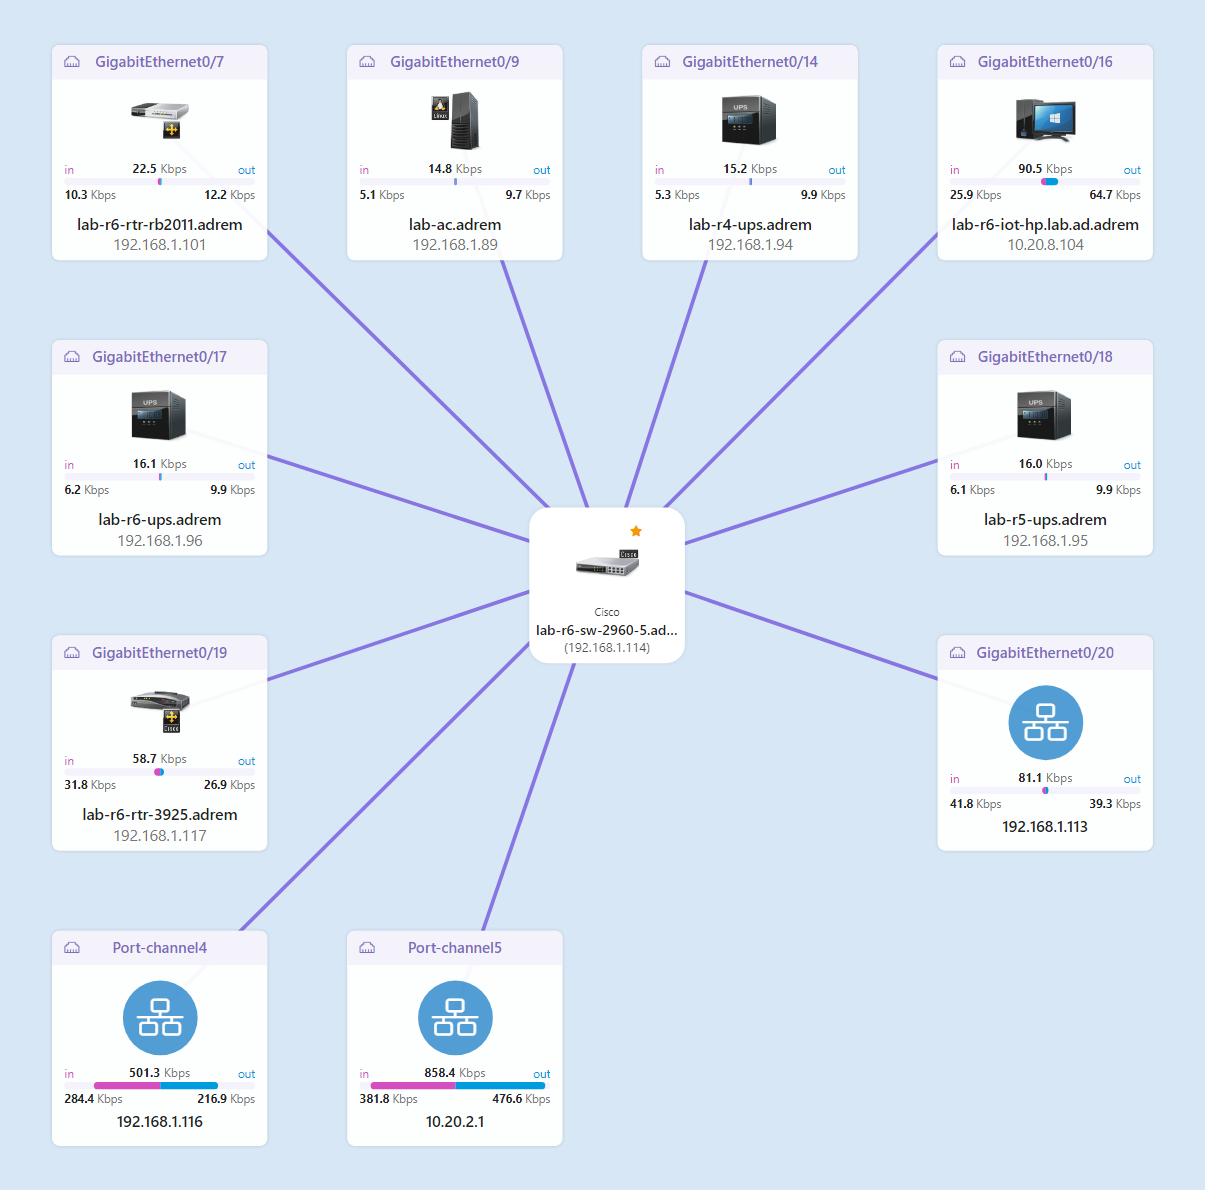
Live Network Interface Status
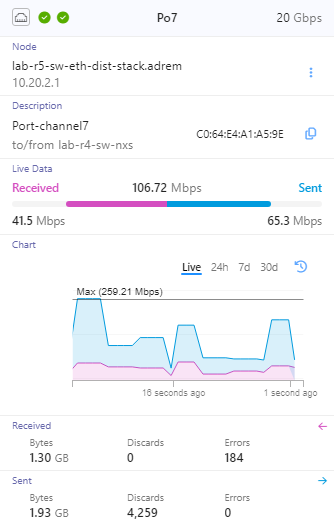
NetCrunch offers views of ports and interfaces of the switch and provides live status for the particular interface.
Custom Views
This section allows you to organize your network data in any way you need. It contains both user-created views and predefined automatic views.
Dynamic Node Views & Folders
Based on typical customer atlases, we prepared many automatic (and dynamic) views for you, such as:
- Nodes with Issues
- Unresponding Nodes
- Responding Nodes with Active Alerts
- Monitoring Probes
- Receiver Nodes
- Business Status Nodes
- Server Types (i.e., Linux, Windows Server, etc.)
- Device Groups (Printers, Switches, Wireless, etc.)
- Workstation Types (Windows 7, Windows 8, Windows 10, etc.)
- Locations (Office, Building 1, Server Room - based on SNMP or manually entered data)
- Network Roles (Network, Printers, Servers, Workstations)
- Windows Domains
- Virtual Machine Hosts
- Organizations
- VLANs
- Operating System Monitoring
- Nodes Using Templates
The views are dynamic, which means they are automatically updated as needed.
Live Maps, Diagrams, and Dashboards (Graphical Data Views)
Graphical views are designed to present various performance and status data in graphical form. They can be diagrams or maps, where you can put many small elements. If they do not fit on the screen, you can drag and zoom as you would on regular maps.
Another option is to create a panel with given proportions and put elements inside it. Such a panel will fit a screen of a given proportion regardless of size. Panels are not scrollable and are always scaled to fit into available space.
Monitoring Dependencies
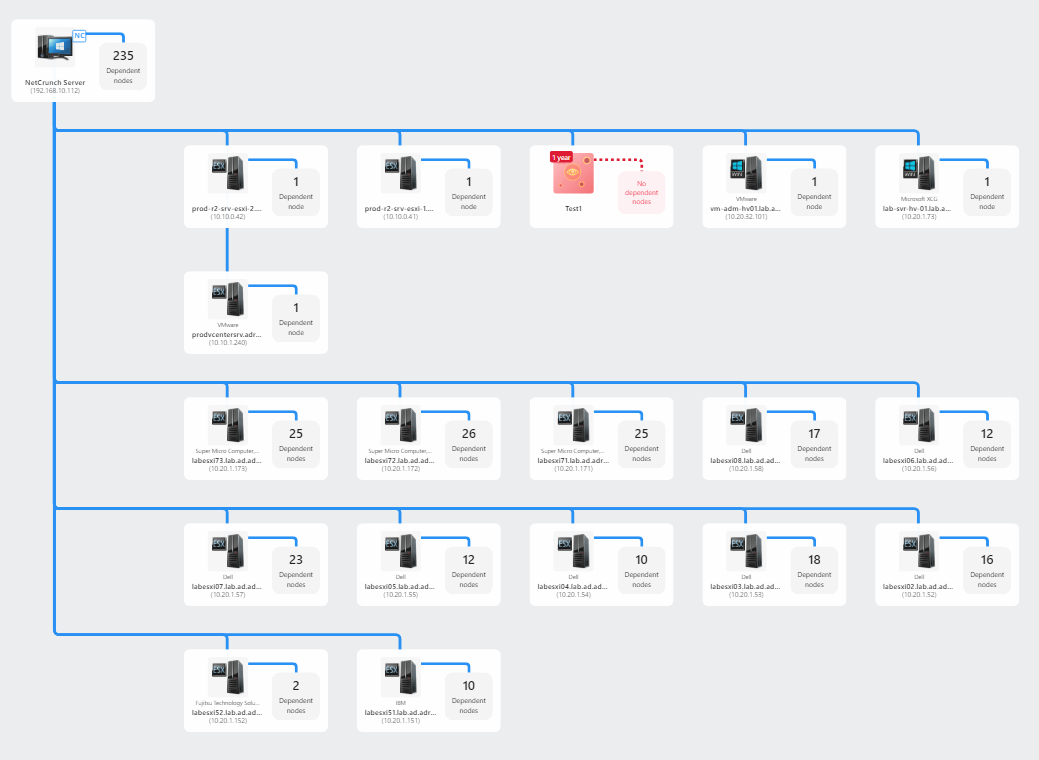
Monitoring Dependencies reflect network connections and allow for preventing false alarms and disabling monitoring of unreachable network components.
NetCrunch allows setting dependencies upon node routes, virtualization hosts, and known switch Layer 2 connections.
Monitoring Packs
Monitoring Pack is a group of performance parameters and events monitored and collected for the reports.
Monitoring Packs can be assigned to a node automatically (by a specific rule like for every Windows Server or for every Cisco switch) or manually. NetCrunch comes with many predefined Monitoring Packs.
Automatic Monitoring by Device Types
Many predefined Monitoring Packs are automatically assigned to nodes based on the node Device Types' setting. The setting can be either automatically discovered or set manually.
Setting a proper Device Type is one of the essential tasks in configuring NetCrunch.
Device types will likely be set automatically for network components retrieved from Active Directory. NetCrunch can also automatically discover many SNMP devices.
Other devices, such as printers or Linux machines, need proper Device Types to monitor.
For example:
When you need to monitor a new macOS device, there are only two easy steps to do:
- add the device to the Atlas
- and set its device type to macOS system.
Then, the node will automatically receive a macOS Monitoring Pack.
It's that simple.
Events & Alerts
Alerts are an essential part of the monitoring program and one of its fundamental use cases. NetCrunch allows advanced alert processing, including correlation, conditional events, conditional actions, and escalation.
To clarify, whether we watch or not, events happen. "Event" becomes an "Alert" as we assign some reaction to it (it becomes an element of interest).
The simplest (default) action stores information about the event in the NetCrunch Event Log. We can assign a different list of actions to each event. The actions can include a notification (email, SMS texting) or some corrective actions, like executing scripts or programs (also on a remote machine). NetCrunch executes actions after the alert starts and when it's closed (finished).
External Events
As a monitoring program, NetCrunch is a primary source of status events and performance metrics alerts (counters). The program can also monitor external events. It matches incoming events with rules and triggers alerting actions for them. This feature allows you to trigger alerts and actions on SNMP traps, syslog messages, text logs, or Windows Event Log entries.
Active Alerts
As many alerts are short-lived and can be self-corrected (like connection or power loss), administrators should concentrate on existing problems instead of constantly looking into the log.
NetCrunch simplifies alert management by correlating all internal alerts so they disappear from the Active Alerts view if closed.
The program allows for correlating external events (SNMP Traps, syslog, etc.) by defining the list of closing events for each external alert.
Conditional Alerts
Simple alerts work when alerting conditions are met, such as "node is down" or when some external notification has been received.
What about something that did not happen, or is it not happening regularly? You can solve such problems with conditional alerts, which allow more complex scenarios such as: notifying when the syslog message was not received or if an event happened in a specified time range.
Available conditions:
- On event
- if event happened after (x) of time
- if the event happened more than (x) times
- Only if within a time range
- Only if not within a time range
- If the event has not happened in a given time range
- if the event did not happen after (x) of time
- if the event is active for more than (x) of time
Correlation
Advanced correlation allows you to trigger events only if multiple events (from different nodes) have happened within a given time range or all are active simultaneously. Active event correlation requires all correlated alerts to be in an active state. This feature easily allows you to define an alert when two redundant interfaces are down.
Alert Actions and Escalation
In response to an event, NetCrunch can execute a sequence of actions. Actions can be executed immediately or with a delay (if the alert is not cleared), and the last action can be repeated. For example, you can send a notification to a particular person and then execute a server restart operation if the event remains active after some time.
See: Alerting Actions
Conditional Actions
Each action can be limited to run only if a triggering network node belongs to a given atlas view (these can be created by rules or manually) or within a given time range. This ability allows you to create flexible alerting scripts, such as sending different notifications depending on the node location. Alerting scripts can be used for multiple alerts, so you can limit actions to executing only when an alert is of a given severity.
Preventing False Alerts
NetCrunch uses various techniques to avoid false alerts or protect against alert floods, sometimes caused by device malfunctions. The program waits several seconds for a device to send a syslog message or SNMP traps to NetCrunch. If the same message appears several times, it won't trigger multiple alerts. NetCrunch uses an event suppression technique to detect false events caused by intermediate connection failures.
NetCrunch Tools
IP Tools
IP Tools is a set of network monitoring tools that allow testing the availability of devices and network services on a host, scanning ports, and checking the routes of test packets or connection bandwidth.
Performance Trend Analyzer
A tool for accessing NetCrunch performance data. You can analyze trend charts and data distributions for a given time. You can compare multiple parameters on a single chart.
SNMP MIB Compiler
This program allows compiling MIB files to extend NetCrunch's MIB library.
Reports
Allows for viewing and managing various NetCrunch reports.