
Network Atlas Views
Read about types of views and how they organize your data.
Network Atlas is a central database containing all your network data. It's organized by the hierarchy of the Atlas Node Views.
The Network Atlas is a part of the Automatic Monitoring and Organizing concept. It is a central repository of all views, grouping network nodes by categories such as nodes from the same network, a single layer 2 segment, or nodes within the same area.
The fundamental element of the Atlas is a network node: a single-address network endpoint. Because many devices use multiple interfaces, they can be grouped, allowing you to monitor only the primary interface.
Atlas Views
Atlas Node View shows various aspects of the group of nodes in the Network Atlas and consists of multiple pages such as nodes, maps, dashboards, and others.
The Atlas Views hierarchy helps you recognize each node group's status. A top-level (root) view of the Atlas contains all nodes, sub-views, and dashboards showing aggregated information for all nodes.
Common Views Properties
- Alerting & Data Collection - You can define alerts that will be inherited by all nodes in the view.
- Top Charts - Specify a list of top charts for the view.
Atlas Sections
Below the Top Level Views are five main sections of the Atlas Views.
IP Networks
This section consists of IP network views/maps. Each network can be periodically re-scanned to reflect its current state. Network maps are usually automatically arranged, and the device model and OS name can be used to group nodes.
Each IP node is a part of some network view. Deleting a node from any IP Network View will also delete it from Atlas. Deleting the View will delete all nodes it contains.
Sites
Networks are grouped into sites. By default, local networks are those accessible directly by the NetCrunch Server's network interfaces.
(0.0.0.0/8) - Empty Network
Sometimes a node is specified by its name, and its address has not yet been resolved. In this case, it belongs to the empty network view.
Specific Properties
-
Automatic node rediscovery - You can set (enabled by default) each network to be automatically scanned to find active nodes. The minimum rediscovery time is 1 hour. You can also specify the exclusions list.
-
Discover New Nodes - You can manually start the discovery of network nodes.
Network Topology
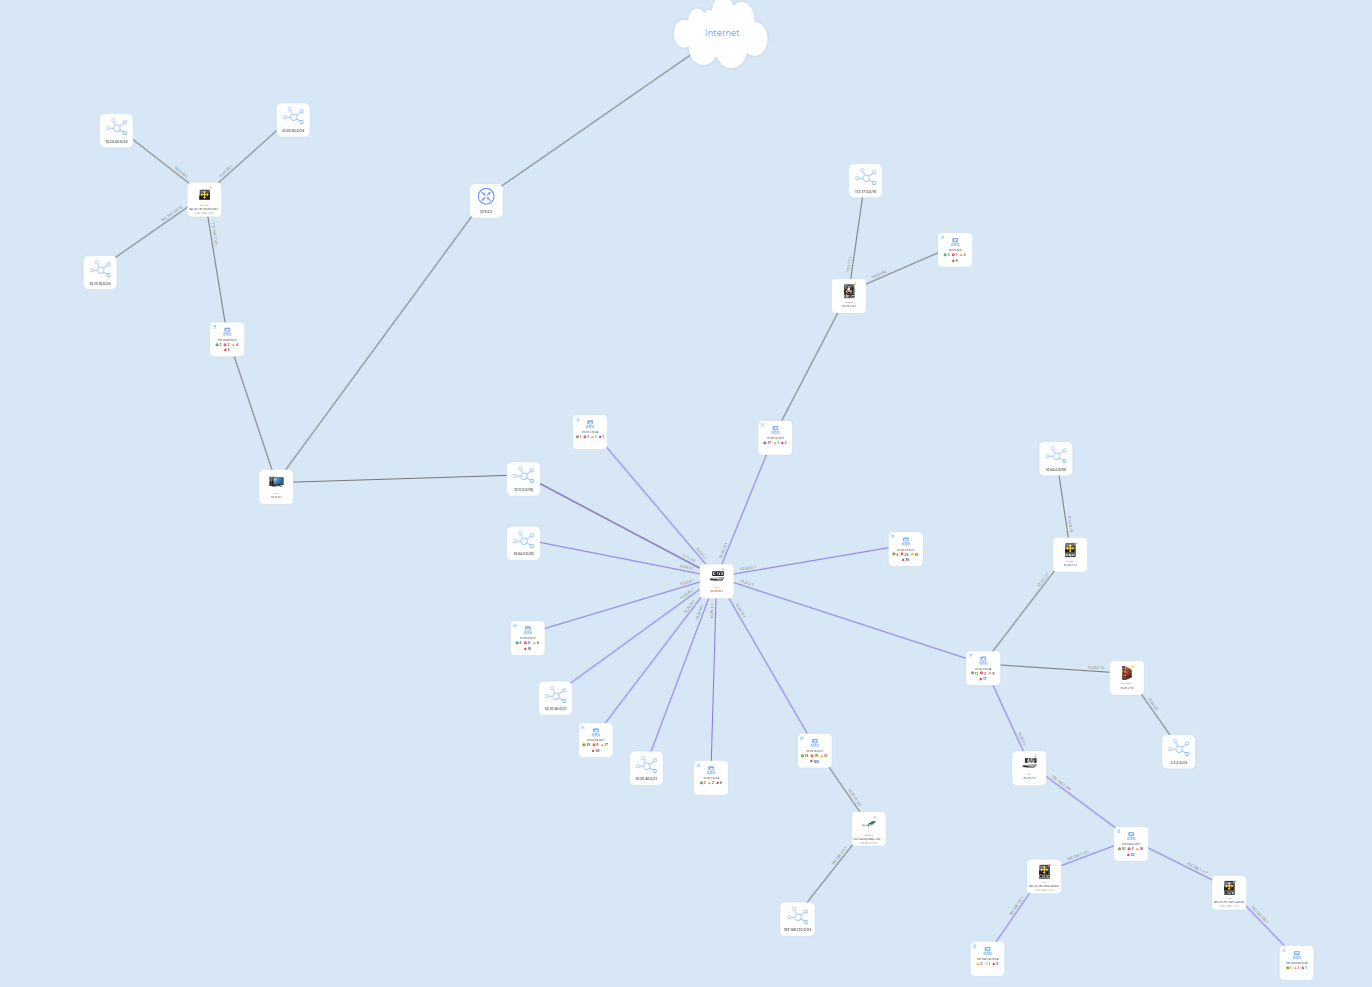
Routing Map
An automatically created view shows a map of logical connections between IP networks. The view is automatically updated when NetCrunch detects topology changes or on demand. You can edit the map and adjust node positions. A routing map is automatically created for each address space.
A routing map can be automatically laid out as a graph or a hybrid map.
Sample Routing Map
Physical Connections
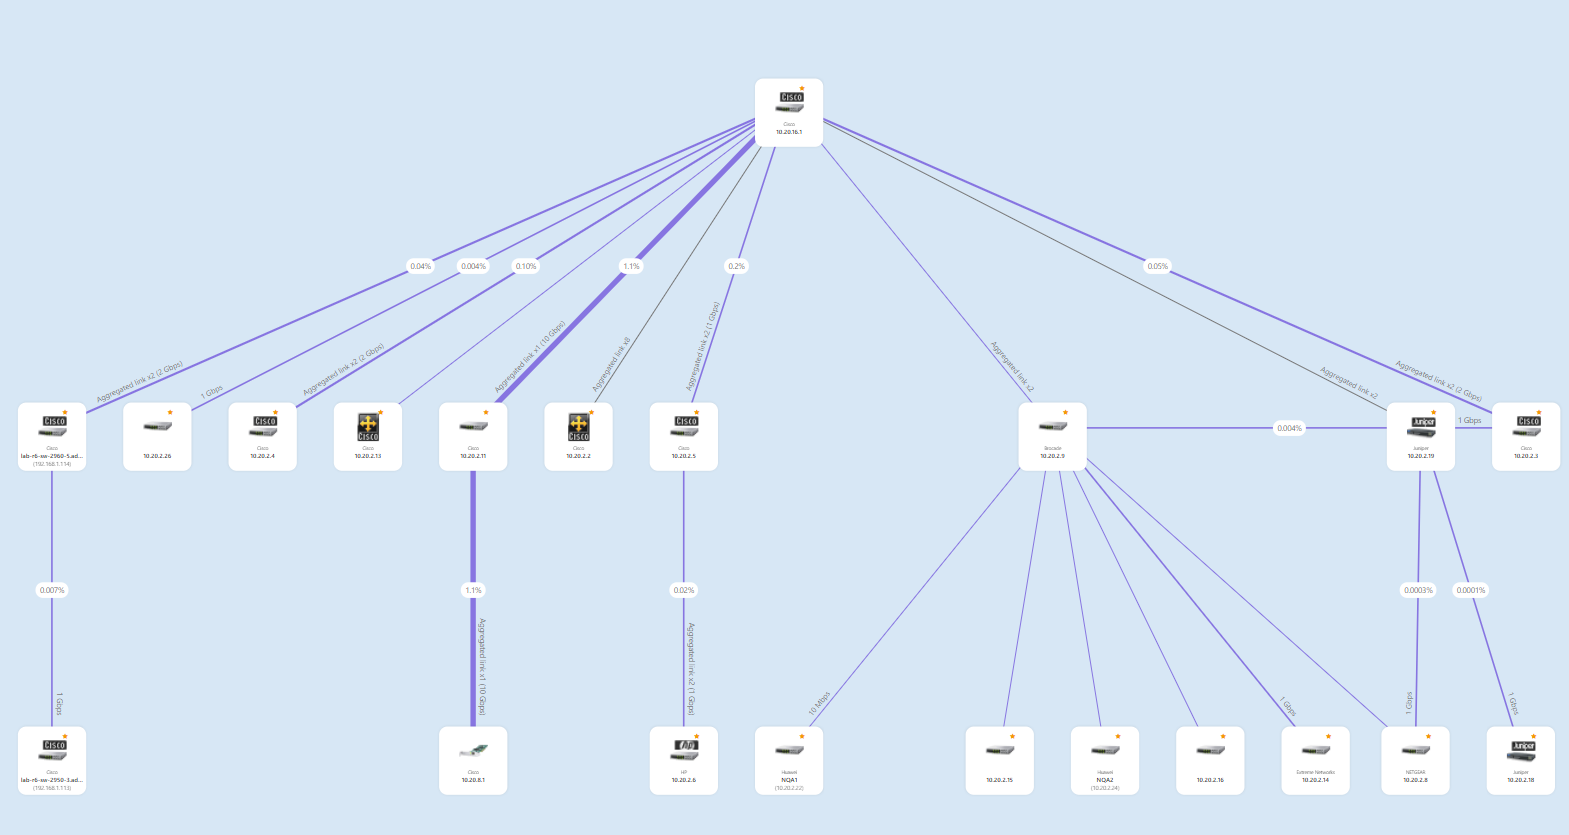
This section contains a hierarchy of views showing Layer 2 connection segments. Each view is automatically arranged and shows the traffic summary for each switch port.
To start monitoring Physical Connections, you need to point the switches to be used to a network topology map. Switches must be defined in the Atlas and have their SNMP profiles correctly set.
After you click on (hamburger menu)Settings Monitoring Physical Connections Monitoring, the Physical Segments Configuration Wizard will start. It will try to find switches that meet the requirements above. If you can't find the switch but know it supports RFC 1493 MIB, please check if it's in the Atlas and its device type is set to Switch.
To create topology maps, NetCrunch primarily uses protocols such as STP, Cisco CDP, and LLDP, and as a fallback, SNMP Forwarding Tables (RFC 1493). Make sure you have enabled CDP or LLDP to ensure the best results.
NetCrunch can create a layout depending on the topology, such as a tree, star, or graph.
Example Tree Topology
Custom Views
This section allows you to organize your network data. Here, you can add your own Node Group Views and manage them using folders. You can create graphical maps for the view and link them. You can also create automatic folders to manage automatically created views.
Automatic Views & Folders
The primary goal of NetCrunch is to monitor the network's state as it changes over time. It’s better to set up and configure views based on rules to maintain dynamic network relations.
Predefined
Based on typical customer Atlases, we prepared some Automatic Views (aka dynamic views) for you:
- Nodes with Monitoring Issues
- Unresponding Nodes
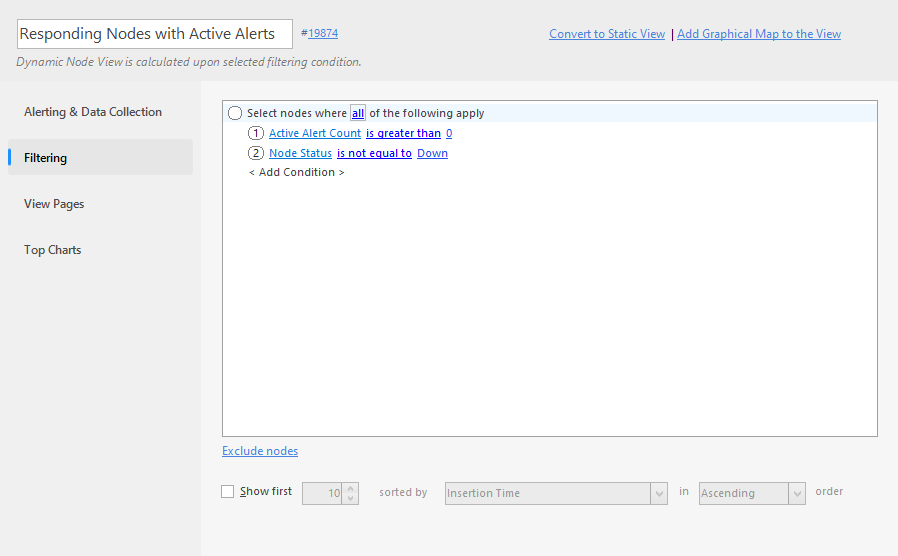
- Responding Nodes with Active Alerts
- Monitoring Probes
- Receiver Nodes
- Composite Status Nodes
- Unknown Device Type
- Server Types (Linux, Windows Server, etc.)
- Device Groups (Printer, Switch, Hardware Router, etc.)
- Workstation Types (Windows 8, Windows 10, Windows 11)
- Locations (Office, Building 1, Server Room - based on SNMP or manually entered data)
- Network Roles (Networking, Servers, Workstations, Printers, Other)
- Windows Domains
- Virtual Machine Hosts
- Organizations
- VLANs
- Operating System Monitoring
- Nodes Using Templates
All Automatic Views are dynamic and automatically update as needed. By default, all empty views are hidden. These views can be modified, and you can treat them as examples of how easy it is to create dynamic views in NetCrunch.
Automatic Folders
You can create a set of automatically updated views as data changes. For example, you want a separate view of each city where devices are located.
You need to specify the node field by which you want to group nodes in views, and you may also decide to make only separate views consisting of more than five elements. Otherwise, nodes will be placed on a single view.
As these views are automatically created and deleted, you can't manage alerts and reports using them.
Specific Properties
- Node Filtering - Specify the filtering condition
- Folder Content - Specify the grouping field and manage groups and their icons
- Appearance - Set an icon for the folder
Dynamic Views
The views are managed through specified filtering conditions (query).
Example:
The domain equals ad.adrem
Specific Properties
- Node Filtering - Specify filtering conditions
Graphical Views
graphical-views
Graphical Views enable the creation of live visual dashboards, maps, and diagrams to represent network and system status. They combine diagrams and widgets with interactive, responsive rendering that adapts to user roles and device type.
Graphical Views are flexible, real-time visualizations used in dashboards, maps, and diagrams. They support both panel-style dashboards and boundless map canvases, offering a unified visual experience.
Key Concepts
-
Panel Views – designed with a fixed aspect ratio and responsive layout. Panels automatically scale to fit the display area, making them ideal for dashboards optimized for desktops, tablets, phones, or large displays. Two scaling modes are available:
- Fit all widgets – scale the panel so only visible elements fill the screen.
- Fit entire panel – scale the full layout area regardless of content.
-
Boundless Maps – scrollable and zoomable freeform canvases ideal for visualizing layouts without screen constraints. Background images (e.g., floorplans or logical schematics) can be freely positioned. These maps are designed for manual panning and zooming, useful when content intentionally exceeds the screen size.
-
Dynamic Content – elements like shapes, lines, icons, and text can be linked to live NetCrunch objects such as nodes, services, or metrics. Their appearance dynamically changes based on object state (e.g., color, visibility, shape).
-
Theming – views automatically adapt to the user's light or dark theme preference. NetCrunch uses a single view definition across themes, unlike other platforms that require duplicating views per style.
Types of Graphical Views
Each view type supports specific layout and interaction patterns:
Free-form Diagrams
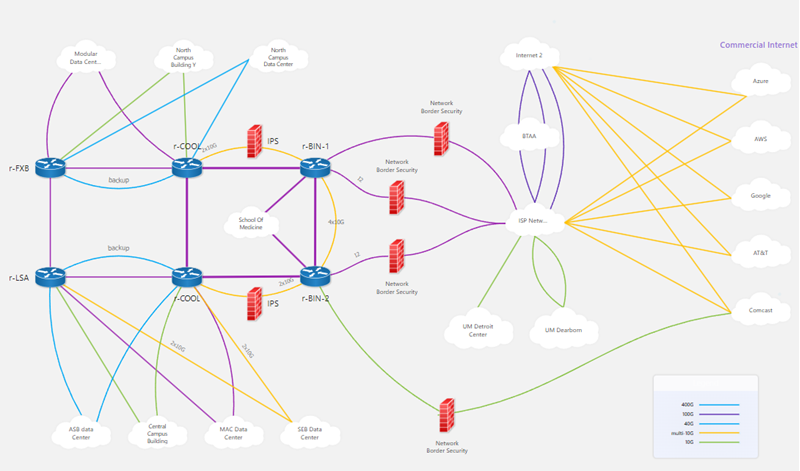
Used to build logical or status-oriented network diagrams. Objects can be positioned manually and connected using live status lines.
Image: Simple network diagram
Boundless Maps
Used for large, navigable visualizations with no fixed layout size. Suitable for: - Floorplans - Wiring diagrams - Device placement maps
Image: Operating boundless diagram
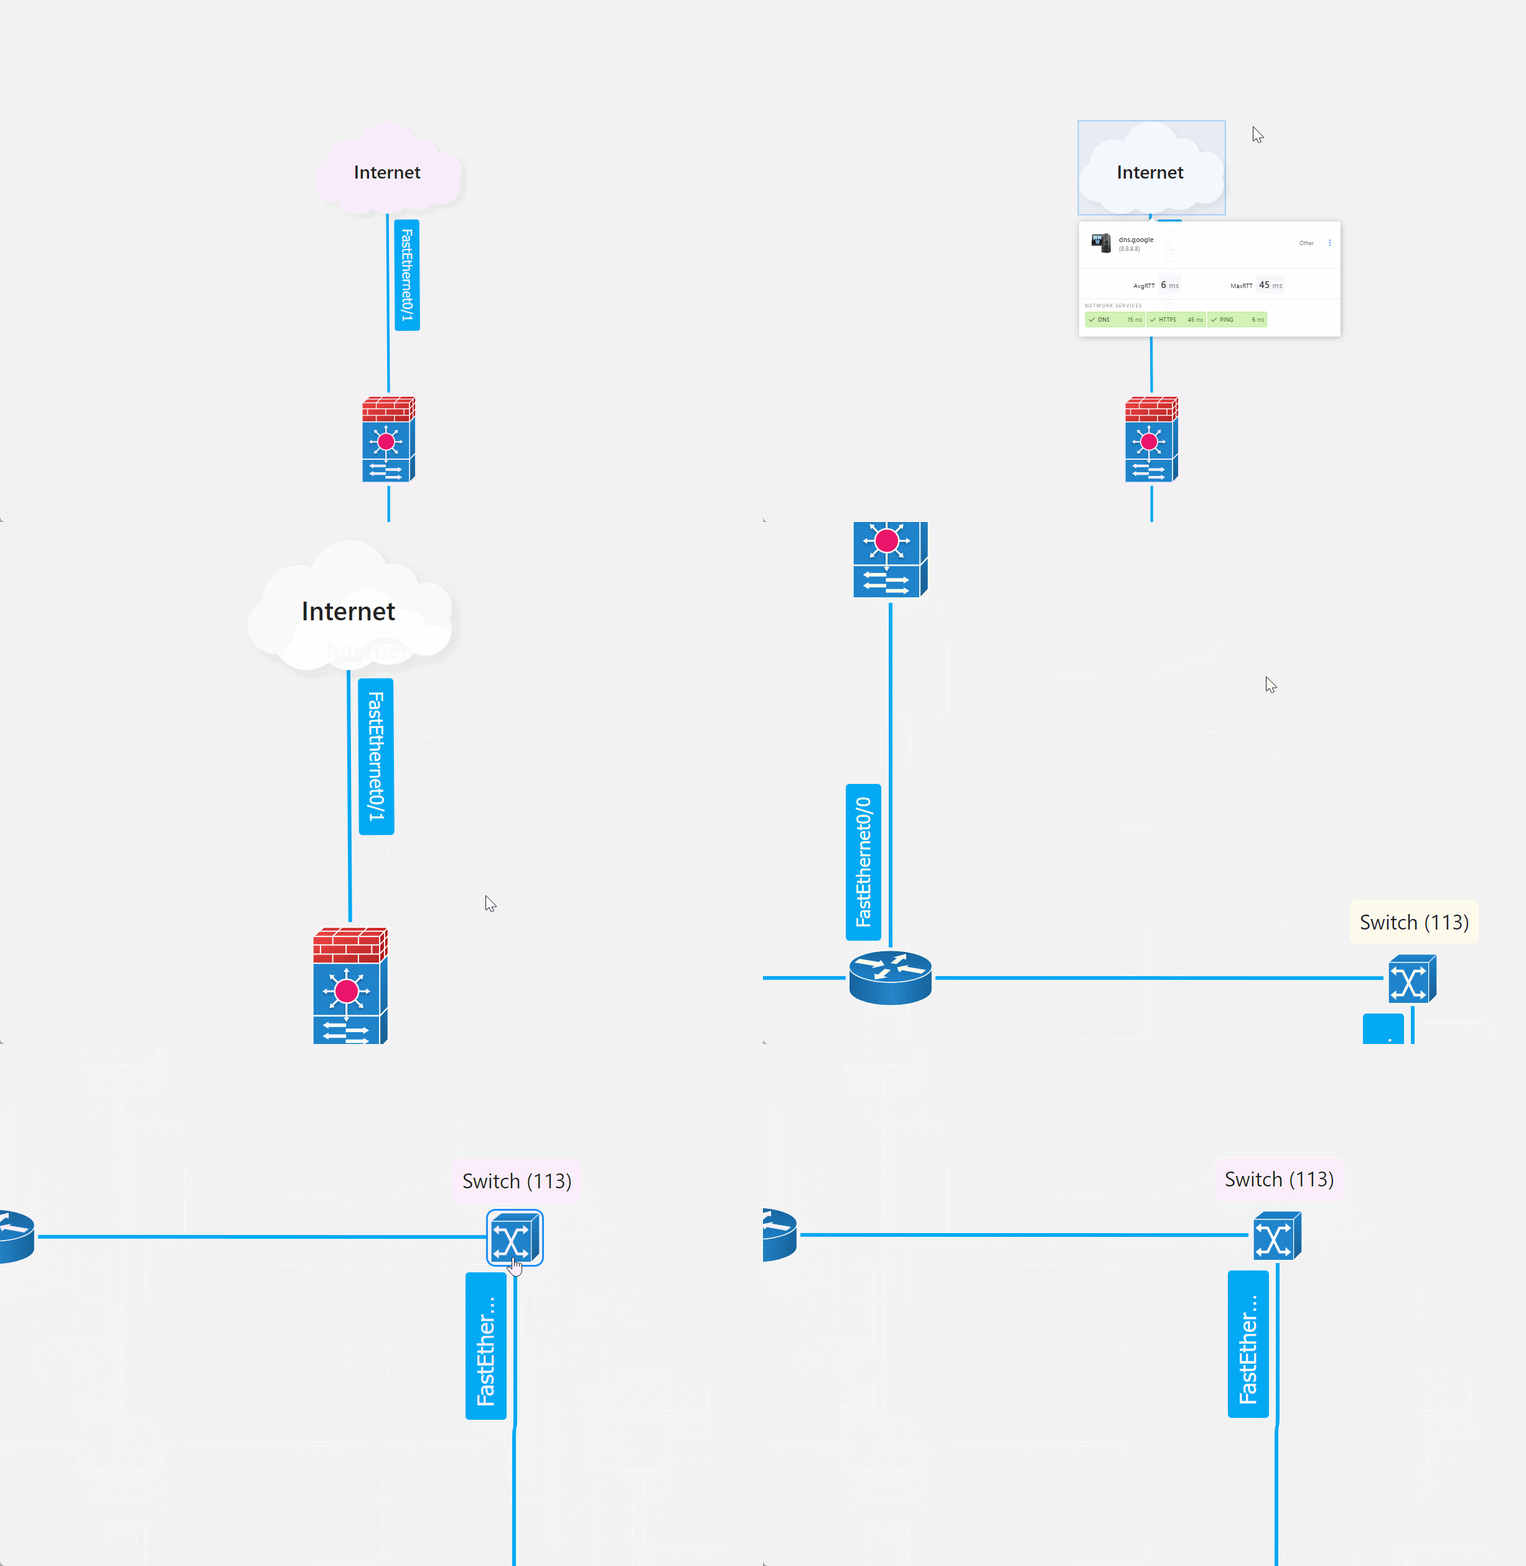
Users can add a background image and freely arrange visual elements without zoom constraints.
Dashboard Panels
Responsive visual containers designed with a fixed aspect ratio. They scale to fit display dimensions while preserving layout. Ideal for: - Mobile dashboards - Status displays - Kiosk and wall-mounted views
Image: Simple dashboard example
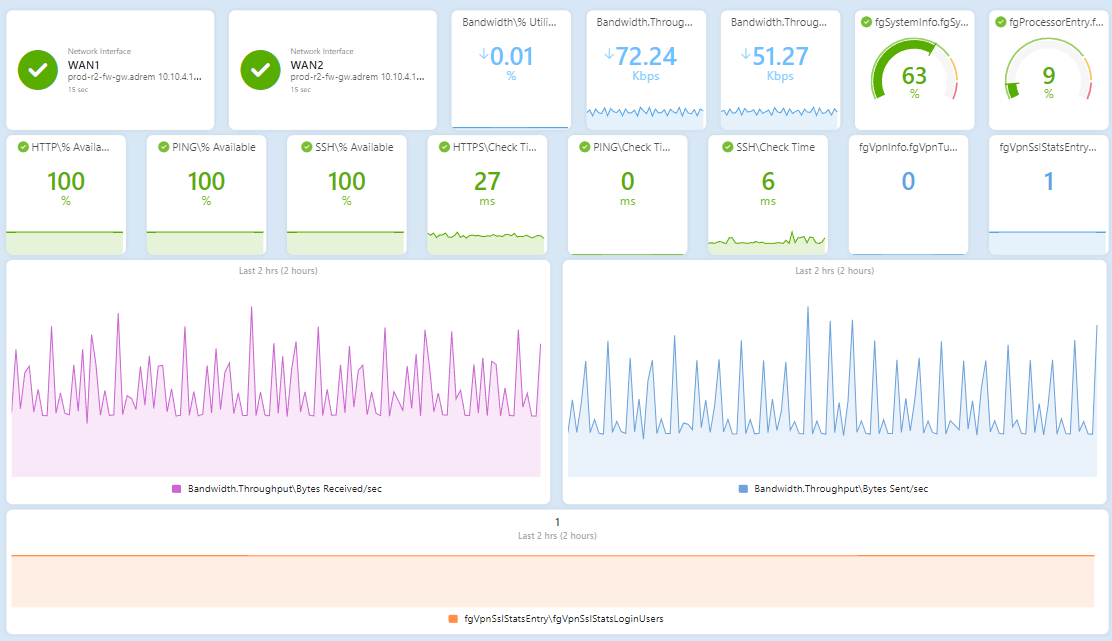
Two smart scaling modes optimize visibility either by content or by full panel size.
Image-based Panels
Use a background image (e.g., rack, datacenter, topology drawing) placed inside a fixed-aspect panel. The image can be scaled and positioned relative to the panel, with live elements overlaid.
Image: Sample floor plan with camera widget
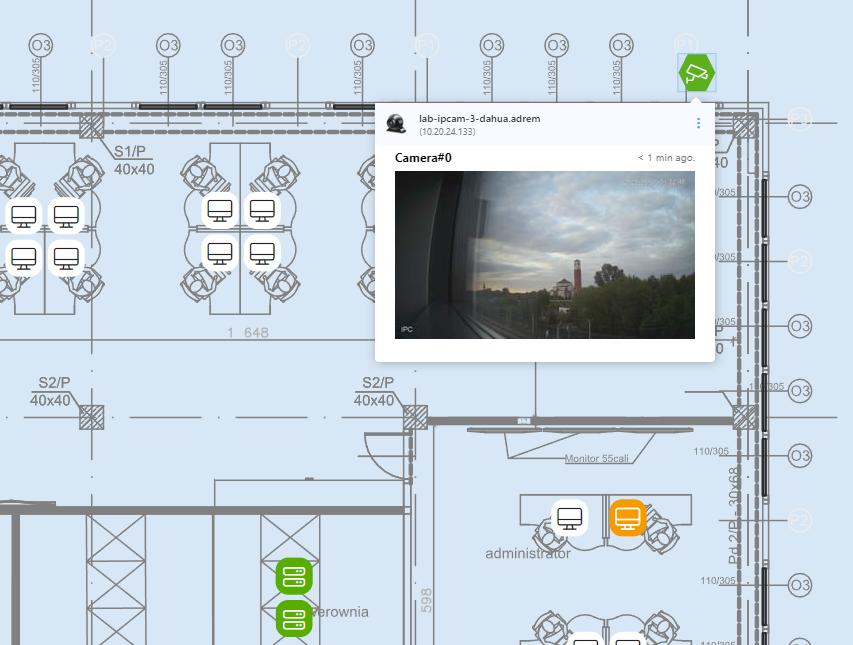
Geographical Maps
Predefined region-based maps with geo-location support. Over 100 maps are available (e.g., countries, states, regions). Unlike embedded browser maps (e.g., Google Maps), these are vector-based contour maps. - Users can place elements based on coordinates. - Locations can be resolved via Google’s geolocation service. - Suitable for regional monitoring dashboards or location-aware topologies.
Image: Camera locations across the world
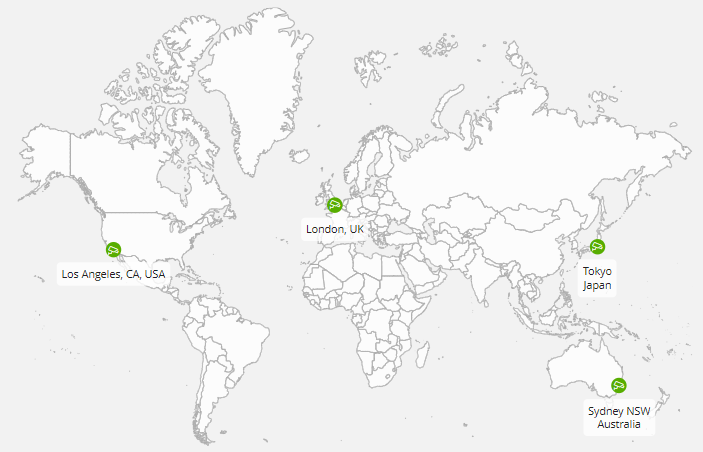
Theming Support
- Users can switch between light and dark modes.
- A single view supports both themes automatically.
- View elements and background adapt accordingly—no duplication needed.
Business Service Views
A Business Service View draws a business service as a diagram, generated from a composite status rather than laid out by hand. The composite you select becomes the root of the view, and the elements it depends on are rendered beneath it as widgets connected by status lines.
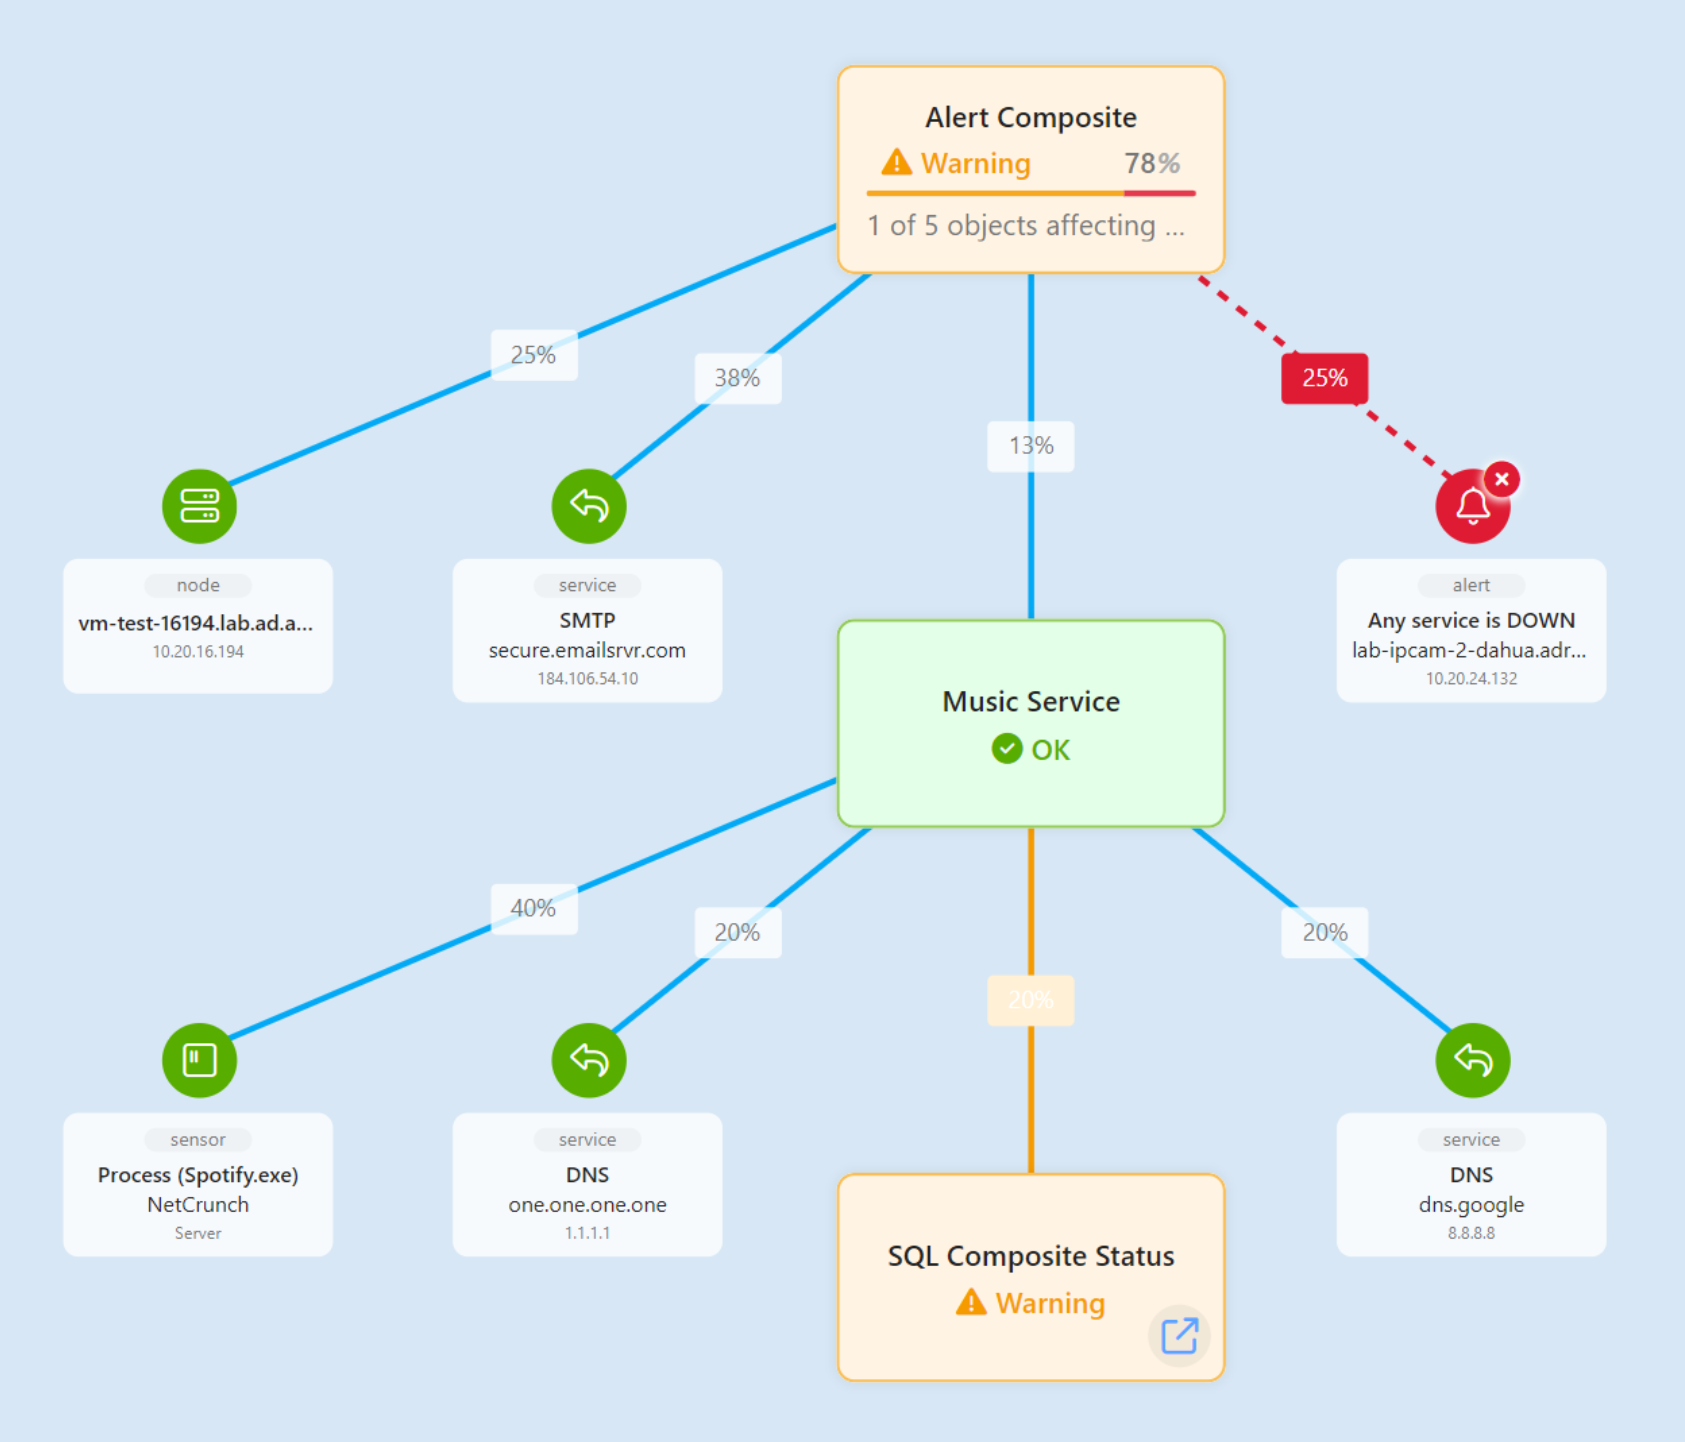
Because a composite status can contain other composite statuses, services nest. A nested composite either expands inline or appears as a link to its own view, which is how the depth of a diagram is controlled.
This is what separates the section from the others: its content is not arranged by you. Change the composite and the diagram changes with it. See Business Service Views.