
Operating System Monitoring
Read about monitoring Windows, macOS, Linux, BSD, Solaris, and ESXi systems.
NetCrunch monitors all operating systems without installing any agents. It's convenient but sometimes requires extra settings to be set on monitored systems.
Windows
Monitoring Windows computers without agents depends on two factors:
- Correct Windows setup – allowing remote access to the system and retrieving performance information.
- Setting
OS Monitoringin node properties – it must be enabled and set to Windows.
Secure and Credential-Aware Monitoring
NetCrunch is designed to monitor Windows systems securely. It:
- Uses Kerberos authentication when operating in Active Directory environments.
- Falls back to NTLM or local credentials if needed.
- Uses a combination of native Windows protocols (RPC, SMB) and WMI depending on the task and available access.
- Applies least-privilege credential use by supporting multiple credential profiles per node.
This ensures compatibility across Windows versions and deployments, even with strict domain policies.
Windows Setup for Monitoring
Windows is the most common desktop OS, but its security configuration can complicate monitoring. Many challenges are automatically resolved when systems operate in an AD domain.
Before enabling monitoring, review the detailed setup steps in the Windows Monitoring Setup topic. We also provide a shell script for configuring standalone systems.
What can be monitored
Windows monitoring includes Windows services, Event Logs, and performance counters. Additional insights are possible with WMI sensors for software, hotfixes, and hardware. You can explore example configurations in the available Monitoring Packs for Windows.
Enable Windows-specific monitoring via:
Node Settings Monitoring Windows
Windows Services
Windows Services monitoring tracks both service states and installation lifecycle.
NetCrunch observes and alerts on the following service states:
- Service is Running
- Service is Paused
- Service is Stopped
- Service is not Running
It also detects service installation or removal events, which are distinct from state changes:
- Service Installed – the service appeared in the system
- Service Uninstalled – the service disappeared from the system
These are treated as event-based alerts, not state-based ones. This distinction is important for software that installs new versions by uninstalling and reinstalling the service — where NetCrunch captures that transitional moment.
Alerts can be defined for:
- A specific service name
- Services matching a regular expression
- All services
Manual service inspection is available at:
Node Status Windows Windows Services
Config Sensors (Device Inventory)
NetCrunch provides a set of configuration sensors (formerly inventory monitor) for monitoring hardware and software configuration changes. Although Windows machines can be monitored with RPC, these sensors require access to WMI, so make sure WMI is enabled and not blocked on the destination machine.
Hardware (WMI)
Using this sensor, you can download and monitor for changes in the hardware configuration of Windows-based hosts. The hardware configuration includes information about the processor, memory, installed disks (storage), video (graphic card), and monitor.
Software (WMI)
The sensor collects information about installed software, including installation date, version, and vendor. It can notify you when new software is installed, uninstalled, or updated.
Hotfixes (WMI)
The sensor collects information about installed hotfixes. It can notify you when a hotfix is installed or uninstalled.
Windows Event Log
NetCrunch can monitor Event Log entries on a given computer. It does it with a WQL query that NetCrunch automatically builds upon your parameters. You can set up this monitoring by adding an alert to the Windows Event Log sensor in Node SettingsMonitoring. Many of the predefined Monitoring Packs also enable Event Log monitoring.
Specify the narrowest query possible. Windows Event Log entries are large, and monitoring all Windows Event Log entries, even on a relatively small number of computers, might overload the NetCruch Event Log database.
Hyper-V Monitoring
NetCrunch allows monitoring Hyper-V services, but you must configure the node to monitor Windows first as it runs on Windows. Then, NetCrunch automatically detects the system is running Hyper-V services and ads.
WMI Sensors
NetCrunch provides several WMI sensors that include executing custom query and monitoring processes, performance counters, or file shares.
Performance Counters
Windows offers many built-in performance counters, which the installed applications extend. NetCrunch allows the defining several types of Event Triggers for Counters on Windows counters. You can set up triggers by adding a new alert to a node or the Monitoring Pack. Settings Alerting & Notifications Monitoring Packs and Policies
Windows OS Monitoring Packs
There are several Monitoring Packs that you can use for monitoring different aspects of your Windows environment.
- Active Directory (automatic)
- Observe Replication and Service errors. Watch Active Directory services status. The operating System must be Windows Server. Monitored network services list contains LDAP, LDAPS
- Active Directory Signs of Compromise
- Monitors for security events signaling potential security breach related to security event pattern, replay attack or audit policy change that need to be investigated
- Basic Windows Monitoring (automatic)
- Provides basic workstation monitoring. Observe processor utilization, memory usage, and free disk space.
Operating System must be Windows Workstation.
Simplified Monitoring must be Disabled. - CPU (automatic)
- Observe CPU utilization.
- DHCP Server
- Observe the DHCP Server service, its errors, and warnings.
- Disk (automatic)
- Observe Windows Disk performance.
- Distributed File System (DFS)
- Observe Windows Event Log for specific DFSR warnings and errors.
- Distributed File System Replication (DFSR)
- Monitor the Windows event log for specific DFSR warnings and errors, and collect performance and capacity data of namespaces and replicated folders.
- DNS Server (automatic)
- Observe DNS errors. Watch DNS network service and Windows service status.
The operating System must be Windows Server.
The monitored network services list contains DNS. - End of Life (automatic)
- Observe Windows system End of Life status.
- Hyper-V Hypervisor
- Observe the overall processor utilization of the Hyper-V environment, and watch its Windows services' status and the Hypervisor state.
- Hyper-V/VM
- Track operational status, guest processor usage, guest memory, virtual processor usage, as well as any failure events.
- Memory (automatic)
- Observe system memory utilization.
- Network (automatic)
- Provides network utilization reports. Observes outbound traffic
- Network Services Health (automatic)
- Watch for DHCP, DNS, WINS, Remote Access, or other TCP/IP errors.
- Processes (Windows)
- It allows for collecting information for processes.
- Security Audit
- Watch for Account events, login, and password problems.
- Terminal Services
- Watch the number of Active and Inactive sessions.
- Windows Print Queue
- Monitor any print queue errors reported by the device.
- MSMQ - Window Message Queuing
- Monitors Windows message queue
- NVIDIA Quadro GPU Dedicated to NVIDIA Quadro graphic cards.
- Alerts about high GPU, Memory, and Bus usage. Shows metrics also from the Core Clock, Fan Speed, Temperature, and Power Consumption.
- RDP Services
- Monitors status of Windows Services related to RDP, additionally shows the number of sessions on a given machine.
- Basic Windows Authorization Monitoring
- Generating an alert in case of multiple failed login events happening over a short time, when a login attempt was made with explicit credentials or with special privileges assigned.
In specific cases, you may need to modify Windows security monitoring packs to prevent alert floods in environments with high numbers of privileged users' logons. - Basic Windows GPO Monitoring
- Tracking changes in Group/Domain/Authorization Policies, generating an alert when such an event occurs.
In specific cases, you may need to modify Windows security monitoring packs to prevent alert floods in environments with high numbers of privileged users' logons.
Windows Applications
- Exchange 2007-2010 Mailbox Access Server
- Monitor key Windows services and performance counters of the Mailbox Access Server.
- Exchange 2007 - 2010 Transport Access Server
- Monitor key Windows services and performance counters of the Transport Access Server, it contains SMTP availability report.
- Exchange 2013 Client Access Role
- Monitor key Windows services and performance counters of the Client Access Server. It contains reports about IMAP4, SMTP, UMCallRouter, and POP3.
- Exchange 2013 Mailbox Role
- Monitor key Windows services and performance counters of the Mailbox Access Server.
- Exchange 2016-2019
- Monitor key Windows services and performance counters of Exchange servers and related services
- IIS
- Monitor key IIS performance metrics such as ASP requests, IIS Private Bytes, and monitor the Windows event log for ASP, SMTP, and WWW errors.
- MS Dynamics NAV Server
- Monitor key Windows Services of the MS Dynamics NAV Server.
- MS Project Server 2013
- Monitor key Windows Services of the MS Project Server 2013.
- MS Project Server 2016
- Monitor key Windows Services of the MS Project Server 2016.
- MS SQL Server 2012-2019
- Monitor key performance metrics, Windows and Network Services, MS SQL event log warnings, and errors. It contains several reports such as:
Processor Bottleneck Analysis, Disk Usage and Performance, Memory Usage Analysis, MS SQL Server 2012-2017 CPU Performance, MS SQL Server 2012-2017 Memory, MS SQL Server 2012-2017 I/O Report - SharePoint 2010
- Watch the status of SharePoint Windows Services, the number of rejected requests, cache size, and the number of queued requests.
- SharePoint 2013
- Watch the status of SharePoint Windows Services, the number of rejected requests, cache size, and the number of queued requests.
- SharePoint 2016
- Watch the status of SharePoint Windows Services, the number of rejected requests, cache size, and the number of queued requests.
Actions
- Run Windows Program
- The program can be copied to and executed on the desired machine.
- Run Windows Script
- Run the script that can be copied to and executed on the desired machine by a given scripting host.
- Terminate Windows Process
- Terminates the process by its name.
- Start, Stop, Pause Windows Service
- Perform control action on a given service. (Specify service by its name or select from the list of running services).
Linux
NetCrunch monitors Linux without agents using an SSH script, which is automatically copied to a remote machine.
Preparing Node for Linux Monitoring
-
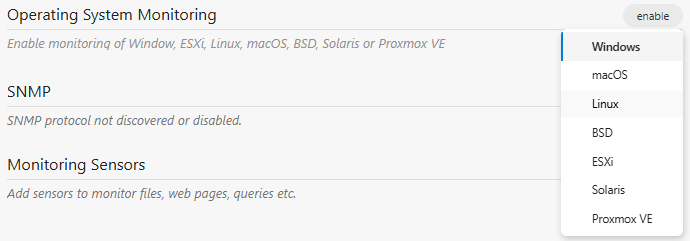
Open Node Settings > Monitoring and enable OS monitoring by selecting Linux from the drop-down menu.
-
Now, you can see the parameters to monitor Linux. Enter SSH credentials unless you use default settings for Linux or add a new credentials profile.
Linux Monitoring Packs
Monitor the most important Linux performance indicators such as processor and memory utilization, free disk space, and available swap, and create a Linux Server Report.
- Linux Status (automatic)
- Observes connection and authentication errors of Linux monitor.
- CPU (automatic)
- Observe CPU utilization.
- Disk (automatic)
- Observe disk utilization, swap available, and the volumes' free space.
- Memory (automatic)
- Observe Available Memory.
- CPU (SNMP)
- It requires SNMP to be enabled. Observe CPU Load and % CPU Time.
- Disk (SNMP)
- It requires SNMP to be enabled. Observe disk utilization, swap available, volumes' free space, and physical disk I/O operations.
- Memory (SNMP)
- It requires SNMP to be enabled. Observe system memory utilization.
- Network Traffic (Linux)
- It allows for collecting network traffic data.
- Processes (Linux)
- It allows for collecting information for processes.
Actions
- Run SSH Script
- Run script using SSH connection can be copied to and executed on the desired machine by a given scripting host.
Scripts
- Shutdown Linux Machine
- Reboot Linux Machine
- Restart Linux SNMP Daemon
- Mount CD-ROM
- Dismount CD-ROM
BSD
NetCrunch monitors BSD without agents using an SSH script, which is automatically copied to a remote machine.
Monitoring Packs
Monitor the most important BSD performance indicators, such as processor and memory utilization, and free disk space, and create a BSD Report.
- BSD Status (automatic)
- Observes connection and authentication errors of BSD monitor.
- CPU (automatic)
- Observe CPU utilization.
- Disk (automatic)
- Observe disk utilization, and volume free space.
- Memory (automatic)
- Observe Available Memory.
- Network Traffic (BSD)
- It allows for collecting network traffic data.
- Processes (BSD)
- It allows for collecting information for processes.
Actions
- Run SSH Script
- Run script using SSH connection can be copied to and executed on the desired machine by a given scripting host.
Solaris
NetCrunch monitors Solaris without agents using only an SSH script, automatically uploaded to the remote machine.
Monitoring Packs
Monitor most important Solaris performance indicators such as processor and memory utilization, and free disk space, and create Solaris Report.
- Solaris Status (automatic)
- Tracks connection and authentication errors of Solaris monitor.
- CPU (automatic)
- Observe CPU utilization.
- Disk (automatic)
- Observe disk utilization, volumes' free space, and swap available
- Memory (automatic)
- Observe Available Memory
- Network Traffic (Solaris)
- It allows for collecting network traffic data.
- Processes (Solaris)
- It allows for collecting information for processes.
- Solaris (SNMP)
- It requires SNMP to be enabled. It monitors CPU Load, Load Check, Minimum Swap Space, and Swap Space.
Actions
- Run SSH Script
- Run script using SSH connection can be copied to and executed on the desired machine by a given scripting host.
macOS
NetCrunch monitors macOS without agents using only an SSH script, automatically uploaded to the remote machine.
Monitoring Packs
Monitor the most important macOS performance indicators. Such as processor and memory utilization, and free disk space, and then create a macOS Report.
- macOS Status (automatic)
- Observes connection and authentication errors of macOS monitor.
- CPU (automatic)
- Observe CPU utilization.
- Disk (automatic)
- Observe disk utilization and volume of free space.
- Memory (automatic)
- Observe Available Memory.
- Processes (macOS)
- It allows for collecting information for processes.
Actions
- Run SSH Script
- Run script using SSH connection can be copied to and executed on the desired machine by a given scripting host.
Other Operating Systems
VMware ESXi
NetCrunch supports direct monitoring of ESXi or using vCenter. Read more in VMware Monitoring.
Legacy Systems
IBM AIX and AS/400
IBM AIX and AS/400 systems can be monitored via SNMP.
IBM Monitoring Packs
- IBM IMM (SNMP)
- Monitors hardware parameters and health condition information related to the components of the system.
- IBM System x Disk (SNMP)
- Shows the status of the physical drive and volume.
- IBM System x System Health (SNMP)
- Monitors the health status of the memory and system. It also shows information about temperature, voltage, and fan speed.
Novell NetWare
As each NetWare system has a pre-installed SNMP agent, monitoring is possible using SNMP.
NetWare Monitoring Pack
Invalid Reference @monitoring-packs:NetWare