
Monitoring Web Pages & Data
NetCrunch can monitor requests, pages, and data on the web.
Node SettingsMonitoringAdd Monitoring Sensor
NetCrunch includes a family of web-monitoring sensors, from a single request through to a full multi-step browser transaction.
web-page
Web Page Sensor
The sensor renders the page as a web browser would. It loads all resources and runs scripts. It's intended for monitoring modern pages or applications. It supports standard login and custom login forms.
Options
- Connection Profile
- Authentication Profile
- Load images
- Run JavaScript
- Follow redirects
Alerts:
- Alert on Monitoring Sensor counter
- Web page does not exist
- Web page loading error
- Page resource load error
- Page content changed
- Alert on HTML element check
- Connection Error
- Authentication Error
Checking Page Content
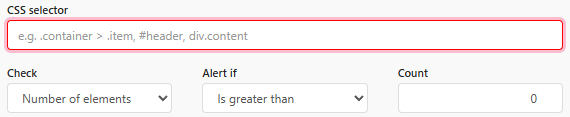
You can test page content in two ways. First, you can search for text patterns using regular expressions within the HTML or text content. Second, you can define a DOM selector to locate an element on the page and then check the text or attributes of that element (or list of elements).
Performance Metrics:
- Web Page.Sensor.Check Time
- Web Page.Page/% Availability - Availability is 100% if HTTP responds with status 200 (OK), otherwise it is 0%
- Web Page.Page/HTTP Status Code - Status code returned by the server
- Web Page.Page/JS Errors - JavaScript execution error (exception) count
- Web Page.Page/Load Time - Total page loading time (ms)
- Web Page.Page/Main Frame Body Size - Length of the page's mainframe content (bytes)
- Web Page.Page/Request Count - Number of requests the page made
- Web Page.Page/Resources Error Count - Page resource loading error (timeout) count
- Web Page.Page/Total Size - Total length of all page resources (bytes)
Report
Default report added collects: % Availability, Load Time, Total Size, Request Count, Resources Error Count. These parameters are also available in the Performance Trend Viewer.
web-transaction
Web Transaction Sensor
The Web Page sensor checks a single page. The Web Transaction sensor checks a sequence — it replays a recorded transaction through the browser, step by step, and reports where the sequence broke.
This is what you use to monitor a process rather than a page: signing in, searching a catalog, adding to a basket, completing a checkout. A site whose front page loads perfectly can still be failing every login attempt, and only a transaction will tell you that.
Checkpoints
A transaction is divided into checkpoints. Each checkpoint is a named step in the sequence, and the name is what you will read in the alert at three in the morning — so name them for what they accomplish, not for the mechanics. Submit login form tells you something; Step 4 does not.
Alerts:
- Web transaction failed
- Alert on Monitoring Sensor counter
When a transaction fails, the alert identifies which checkpoint failed rather than reporting only that the transaction did not complete. The event details carry a screenshot of the page at the failed checkpoint, so you can see the state the browser was actually in — an unexpected consent dialog, an expired session, a validation error on a form — without reproducing the failure yourself.
basic-http
Basic HTTP Sensor
This sensor sends a single request and can alert based on the response code or specific response data. It supports GET, HEAD, and POST requests. The sensor allows you to set custom request headers and cookies. Additionally, it can follow redirects (disabled by default) and alert if there are issues with the SSL certificate.
Alerts:
- Alert on Monitoring Sensor counter
- HTTP response code is not OK
- Server responded with error code
- Certificate expired
- Certificate is about to expire
- Certificate changed
- Certificate revoked
- Alert on SSL Certificate field conformance
- Connection Error
- Authentication Error
Performance Metrics:
- Basic HTTP.Sensor.Check Time
- Basic HTTP.Response/% Availability - Availability is 100% if HTTP responds, otherwise it is 0%
- Basic HTTP.Response/Content Length - Response content length (bytes)
- Basic HTTP.Response/Length - Full HTTP response length in bytes (includes header size)
- Basic HTTP.Response/Time - HTTP response time (ms)
Report
By default, the sensor adds a report containing: % Availability, Response Time, and Content Length charts. These metrics will be collected and available as a report or through Performance Trend Viewer
rest-http
REST HTTP
Similar to the Basic HTTP sensor, this sensor can send a single request and alert based on the response code or specific response data. Additionally, it can send any type of HTTP request, including custom requests, and easily add URL query parameters. It also allows setting custom request headers and cookies. Additionally, it can follow a redirect (the option is off by default) or alert if there is a problem with the SSL certificate.
Alerts:
- Alert on Monitoring Sensor counter
- HTTP response code is not OK
- Server responded with error code
- Certificate expired
- Certificate is about to expire
- Certificate changed
- Alert on SSL Certificate field check
- Connection Error
- Authentication Error
Performance Metrics:
- REST HTTP.Sensor.Check Time
- REST HTTP.Response/Content Length - Response content length (bytes)
- REST HTTP.Response/Length - Full HTTP response length in bytes (includes header size).
- REST HTTP.Response/Time - HTTP response time (ms)
The sensor processes any received data and converts it into counters and status objects using Data Parses.
HTTP/s File Sensor
Check remote file content and authentication parameters, monitor remote text logs, file size, or change time, presence, and more. See Monitoring Files and Folders.